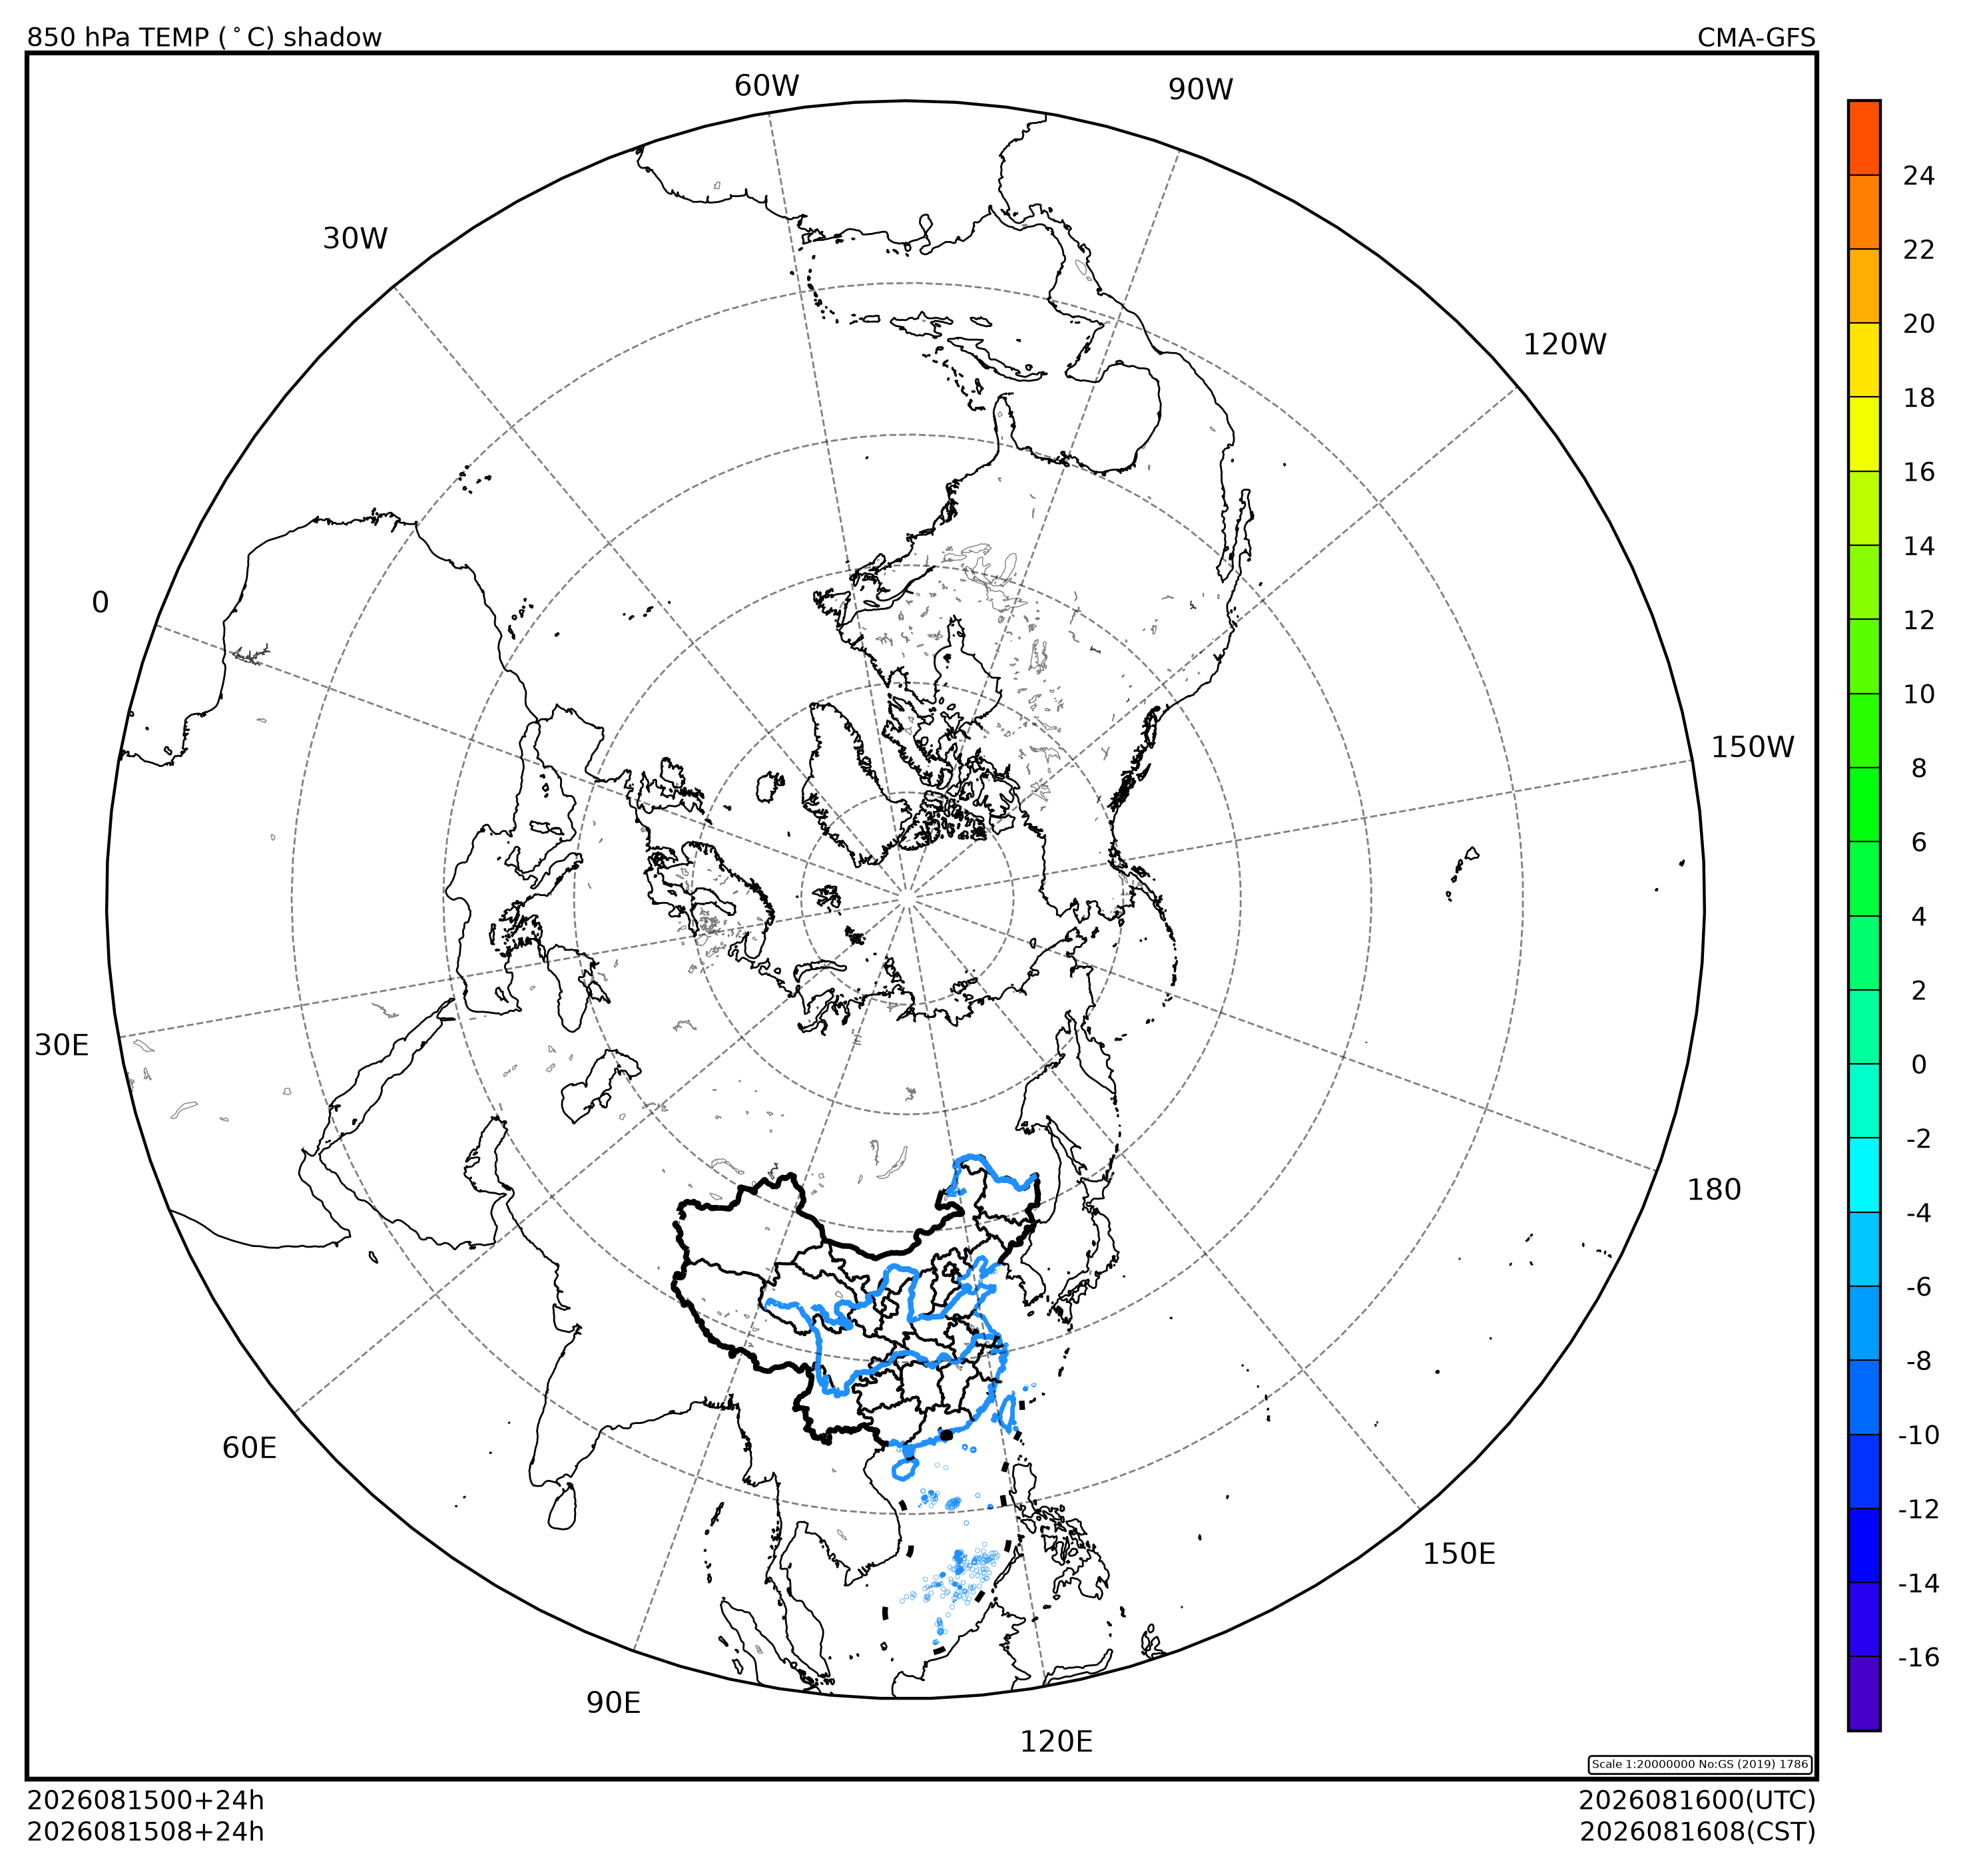
北半球底图布局 (cedarkit.plots.domains.NorthPolarMapTemplate) 绘制北半球图形,使用北半球立体投影 (cartopy.crs.NorthPolarStereo),默认中心经度东经 110 度。
准备
导入需要的包
import numpy as np
import pandas as pd

from cedarkit.plots.chart import Panel
from cedarkit.plots.domains import NorthPolarMapTemplate
from cedarkit.plots.map import set_default_map_loader_package
from cedarkit.plots.style import ContourStyle
from cedarkit.plots.colormap import get_ncl_colormap
start_time = pd.Timestamp.now().normalize() - pd.Timedelta(days=2)
forecast_time = pd.to_timedelta("24h")
设置使用 CEMC 地图包
set_default_map_loader_package("cedarkit.plots.map.cemc")'cedarkit.plots.map.cemc'定义绘图样式
contour_lev = np.arange(-16, 25, 2)
color_map = get_ncl_colormap(
    "rainbow+white+gray",
    index=np.arange(38, 207, 8),
)
t_style = ContourStyle(
    colors=color_map,
    levels=contour_lev,
    fill=True,
)绘制
绘制底图布局
domain = NorthPolarMapTemplate()
panel = Panel(domain=domain)

domain.set_title(
    panel=panel,
    graph_name=r"850 hPa TEMP ($^\circ$C) shadow",
    system_name="CMA-GFS",
    start_time=start_time,
    forecast_time=pd.to_timedelta("24h"),
)
domain.add_colorbar(panel=panel, style=t_style)

panel.show()