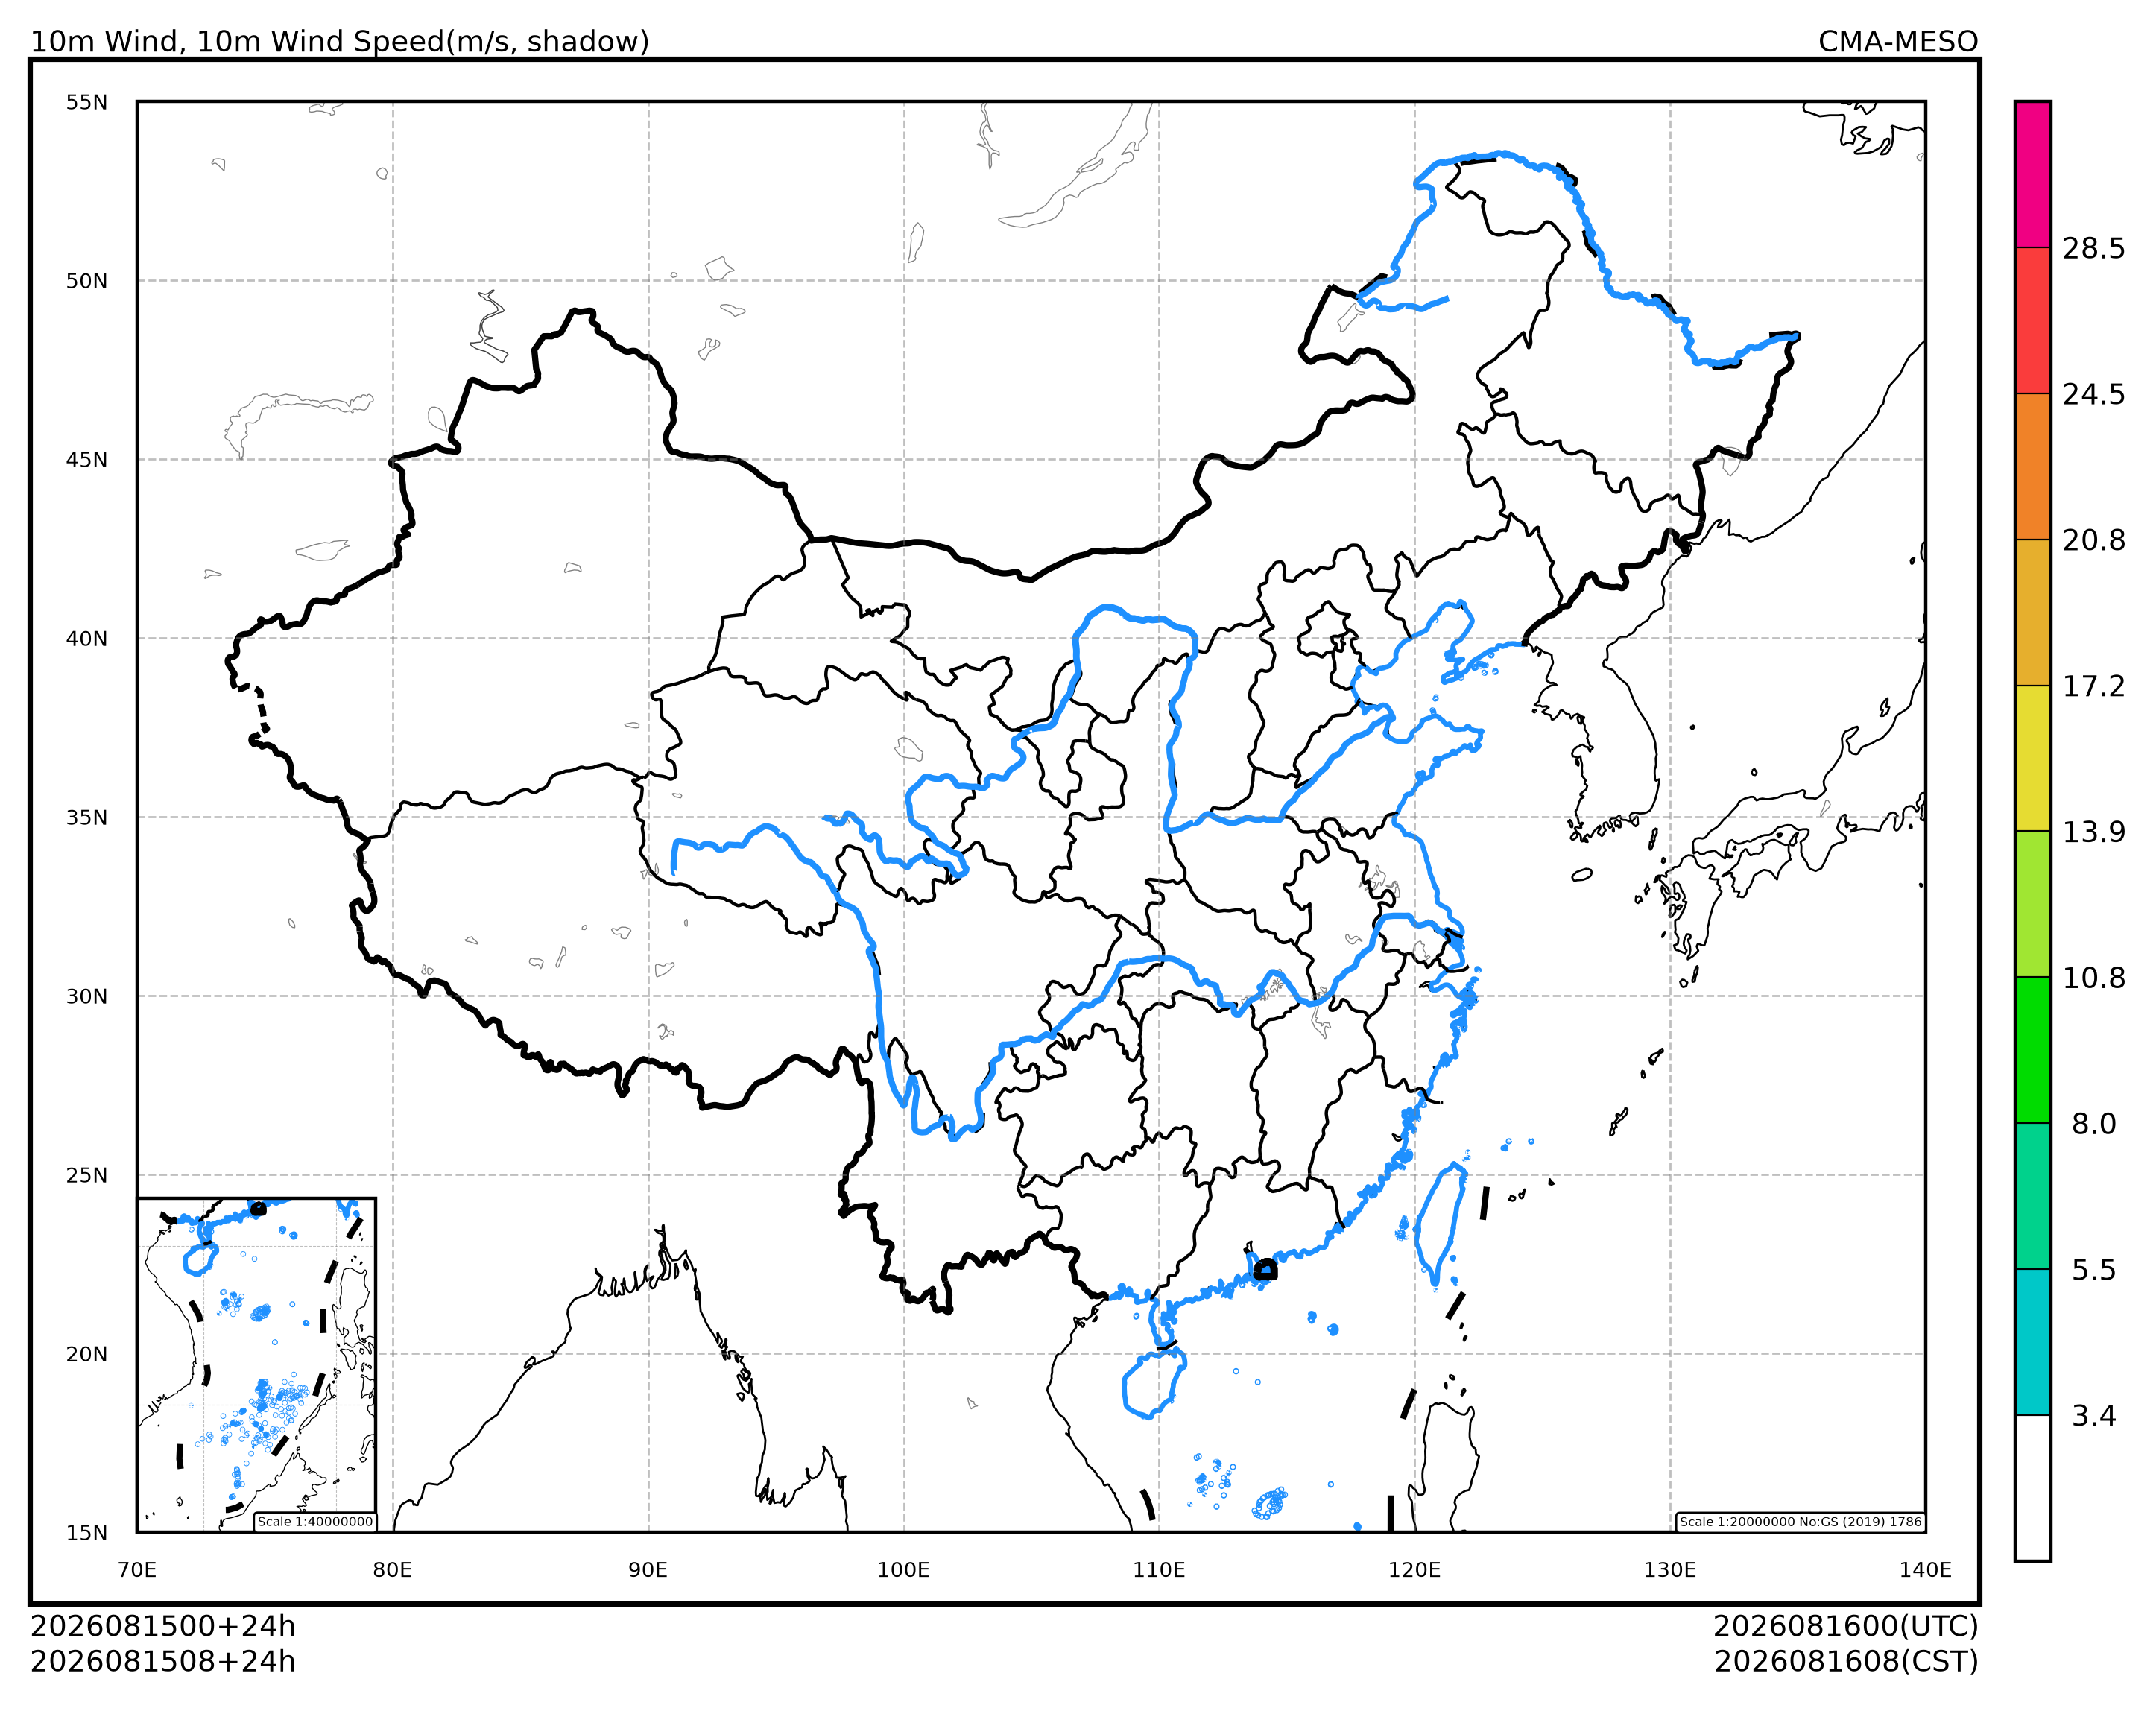
东亚区域 (cedarkit.plots.domains.EastAsiaMapTemplate) 用于绘制中国范围图形,包括中国区域和南海子图两个图层。
默认区域范围北纬 15 - 55,东经 70 - 140,使用简易圆柱投影 (cartopy.crs.PlateCarree)。
准备
导入需要的包
import numpy as np
import pandas as pd
import matplotlib.colors as mcolors

from cedarkit.plots.chart import Panel
from cedarkit.plots.domains import EastAsiaMapTemplate
from cedarkit.plots.map import set_default_map_loader_package
from cedarkit.plots.style import ContourStyle
start_time = pd.Timestamp.now().normalize() - pd.Timedelta(days=2)
forecast_time = pd.to_timedelta("24h")
设置使用 CEMC 地图包
set_default_map_loader_package("cedarkit.plots.map.cemc")'cedarkit.plots.map.cemc'定义绘图样式
map_colors = np.array([
    (255, 255, 255),
    (0, 0, 0),
    (255, 255, 255),
    (0, 200, 200),
    (0, 210, 140),
    (0, 220, 0),
    (160, 230, 50),
    (230, 220, 50),
    (230, 175, 45),
    (240, 130, 40),
    (250, 60, 60),
    (240, 0, 130),
    (0, 0, 255),
    (255, 140, 0),
    (238, 18, 137)
], dtype=float) / 255
colormap = mcolors.ListedColormap(map_colors)

wind_speed_colormap = mcolors.ListedColormap(
    colormap(np.array([2, 3, 4, 5, 6, 7, 8, 9, 10, 11]))
)
wind_speed_contour_lev = np.array(
    [3.4, 5.5, 8, 10.8, 13.9, 17.2, 20.8, 24.5, 28.5]
)
wind_speed_style = ContourStyle(
    colors=wind_speed_colormap,
    levels=wind_speed_contour_lev,
    fill=True,
)绘制
绘制底图布局
domain = EastAsiaMapTemplate()
panel = Panel(domain=domain)

domain.set_title(
    panel=panel,
    graph_name="10m Wind, 10m Wind Speed(m/s, shadow)",
    system_name="CMA-MESO",
    start_time=start_time,
    forecast_time=pd.to_timedelta("24h"),
)
domain.add_colorbar(panel=panel, style=wind_speed_style)

panel.show()