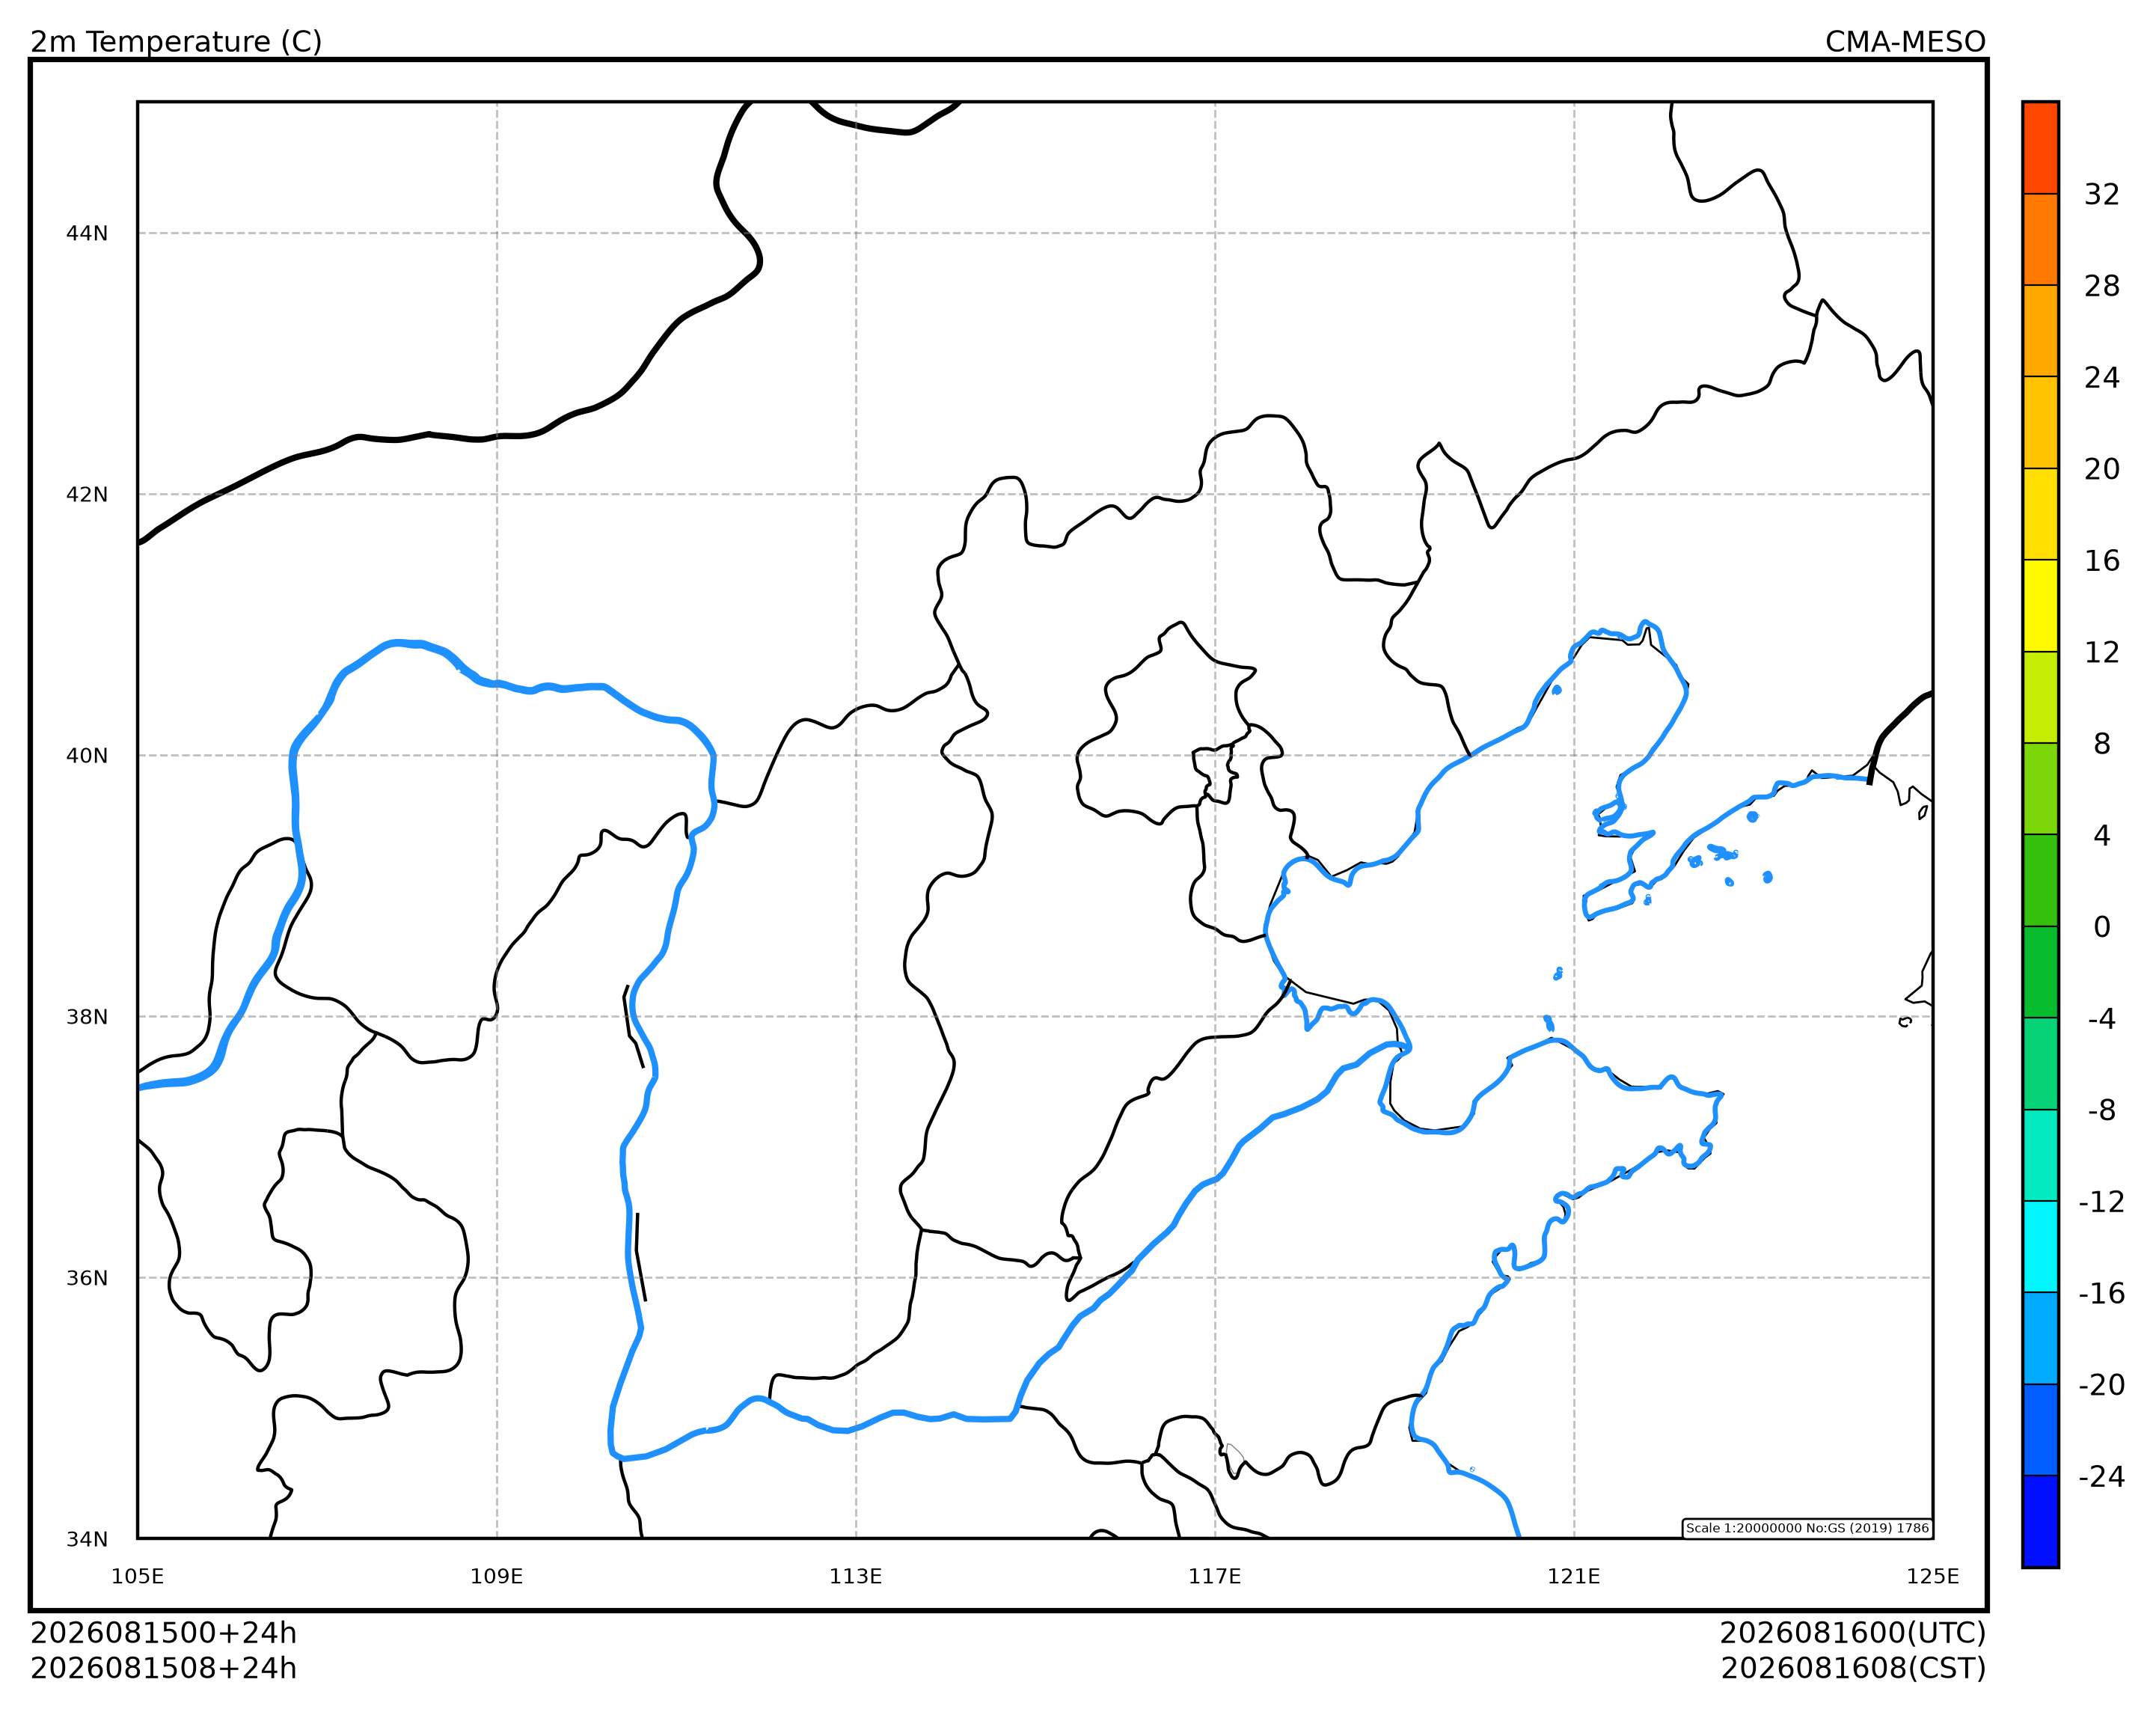
中国区域 (cedarkit.plots.domains.CnAreaMapTemplate) 继承自东亚区域 (cedarkit.plots.domains.EastAsiaMapTemplate),默认不绘制南海子图。
准备
导入需要的包
import pandas as pd
import matplotlib.colors as mcolors

from cedarkit.plots.chart import Panel
from cedarkit.plots.domains import CnAreaMapTemplate
from cedarkit.plots.map import set_default_map_loader_package
from cedarkit.plots.style import ContourStyle
from cedarkit.plots.colormap import get_ncl_colormap
from cedarkit.plots.types import AreaRange
start_time = pd.Timestamp.now().normalize() - pd.Timedelta(days=2)
forecast_time = pd.to_timedelta("24h")
设置使用 CEMC 地图包
set_default_map_loader_package("cedarkit.plots.map.cemc")'cedarkit.plots.map.cemc'定义绘图样式
color_map = get_ncl_colormap("BlAqGrYeOrReVi200")
t_2m_level = [-24, -20, -16, -12, -8, -4, 0, 4, 8, 12, 16, 20, 24, 28, 32]
color_index = [2, 12, 22, 32, 42, 52, 62, 72, 82, 92, 102, 112, 122, 132, 142, 152]

t_2m_color_map = mcolors.ListedColormap(color_map(color_index))
t_2m_style = ContourStyle(
    colors=t_2m_color_map,
    levels=t_2m_level,
    fill=True,
)绘制
定义华北区域
area = AreaRange.from_tuple((105, 125, 34, 45))绘制底图布局
domain = CnAreaMapTemplate(area=area)
panel = Panel(domain=domain)

domain.add_colorbar(panel=panel, style=t_2m_style)

domain.set_title(
    panel=panel,
    graph_name="2m Temperature (C)",
    system_name="CMA-MESO",
    start_time=start_time,
    forecast_time=pd.to_timedelta("24h"),
)

panel.show()