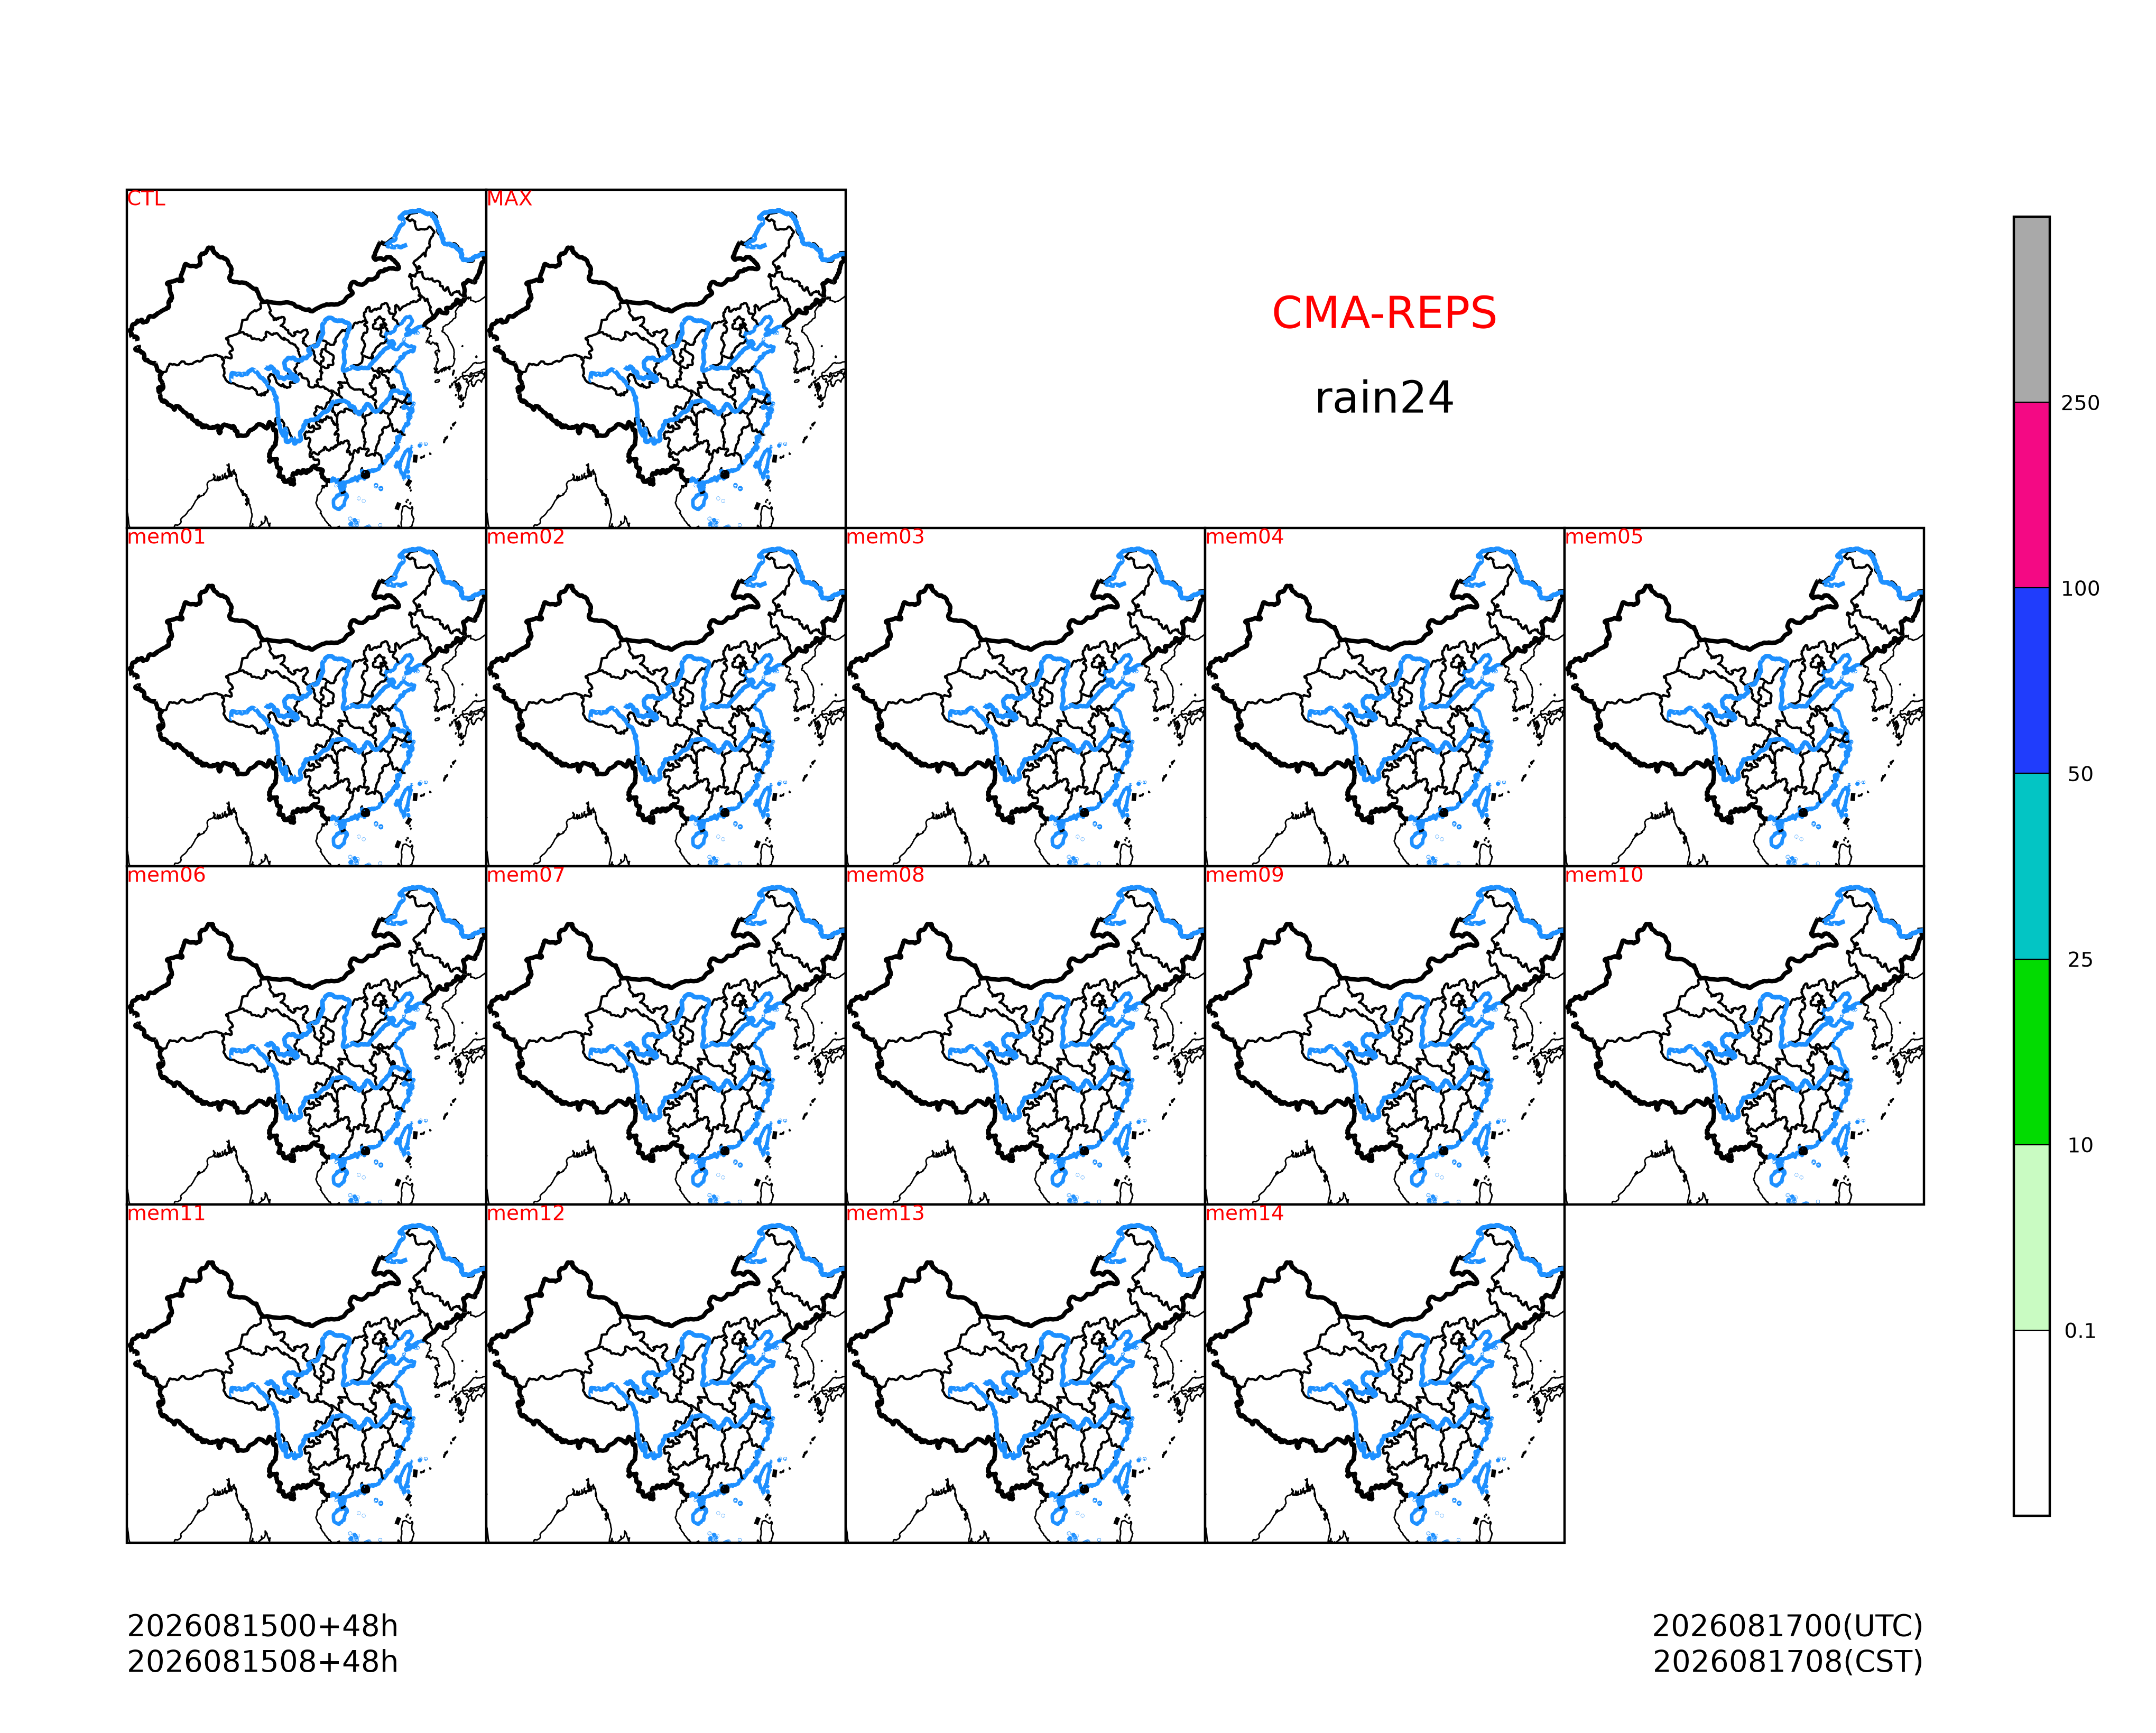
中国区域集合邮票图底图布局 (cedarkit.plots.domains.EnsCnMapTemplate) 用于绘制集合预报邮票图,使用简易圆柱投影 (cartopy.crs.PlateCarree)。
准备
导入需要的包
import pandas as pd
import matplotlib.colors as mcolors

from cedarkit.plots.chart import Panel, Schema
from cedarkit.plots.map import set_default_map_loader_package
from cedarkit.plots.domains.ens_cn import EnsCNMapTemplate
from cedarkit.plots.style import ContourStyle
start_time = pd.Timestamp.now().normalize() - pd.Timedelta(days=2)
forecast_time = pd.to_timedelta("24h")
设置使用 CEMC 地图包
set_default_map_loader_package("cedarkit.plots.map.cemc")'cedarkit.plots.map.cemc'定义绘图样式
color_list = ['#fefefe', '#c9fbc2', '#02db01', '#03c5c4', '#203dfc', '#f40984', '#a9a9a9']
color_map = mcolors.ListedColormap(color_list)
contour_style = ContourStyle(
    levels=[0.1, 10, 25, 50, 100, 250],
    colors=color_map,
    fill=True,
)绘制
绘制底图布局
domain = EnsCNMapTemplate(enable_max=True)
panel = Panel(domain=domain, schema=Schema(figsize=(10, 8)))

domain.set_title(
    panel=panel,
    graph_name="rain24",
    system_name="CMA-REPS",
    start_time=start_time,
    forecast_time=pd.to_timedelta("48h")
)
domain.add_colorbar(panel=panel, style=contour_style)

panel.show()