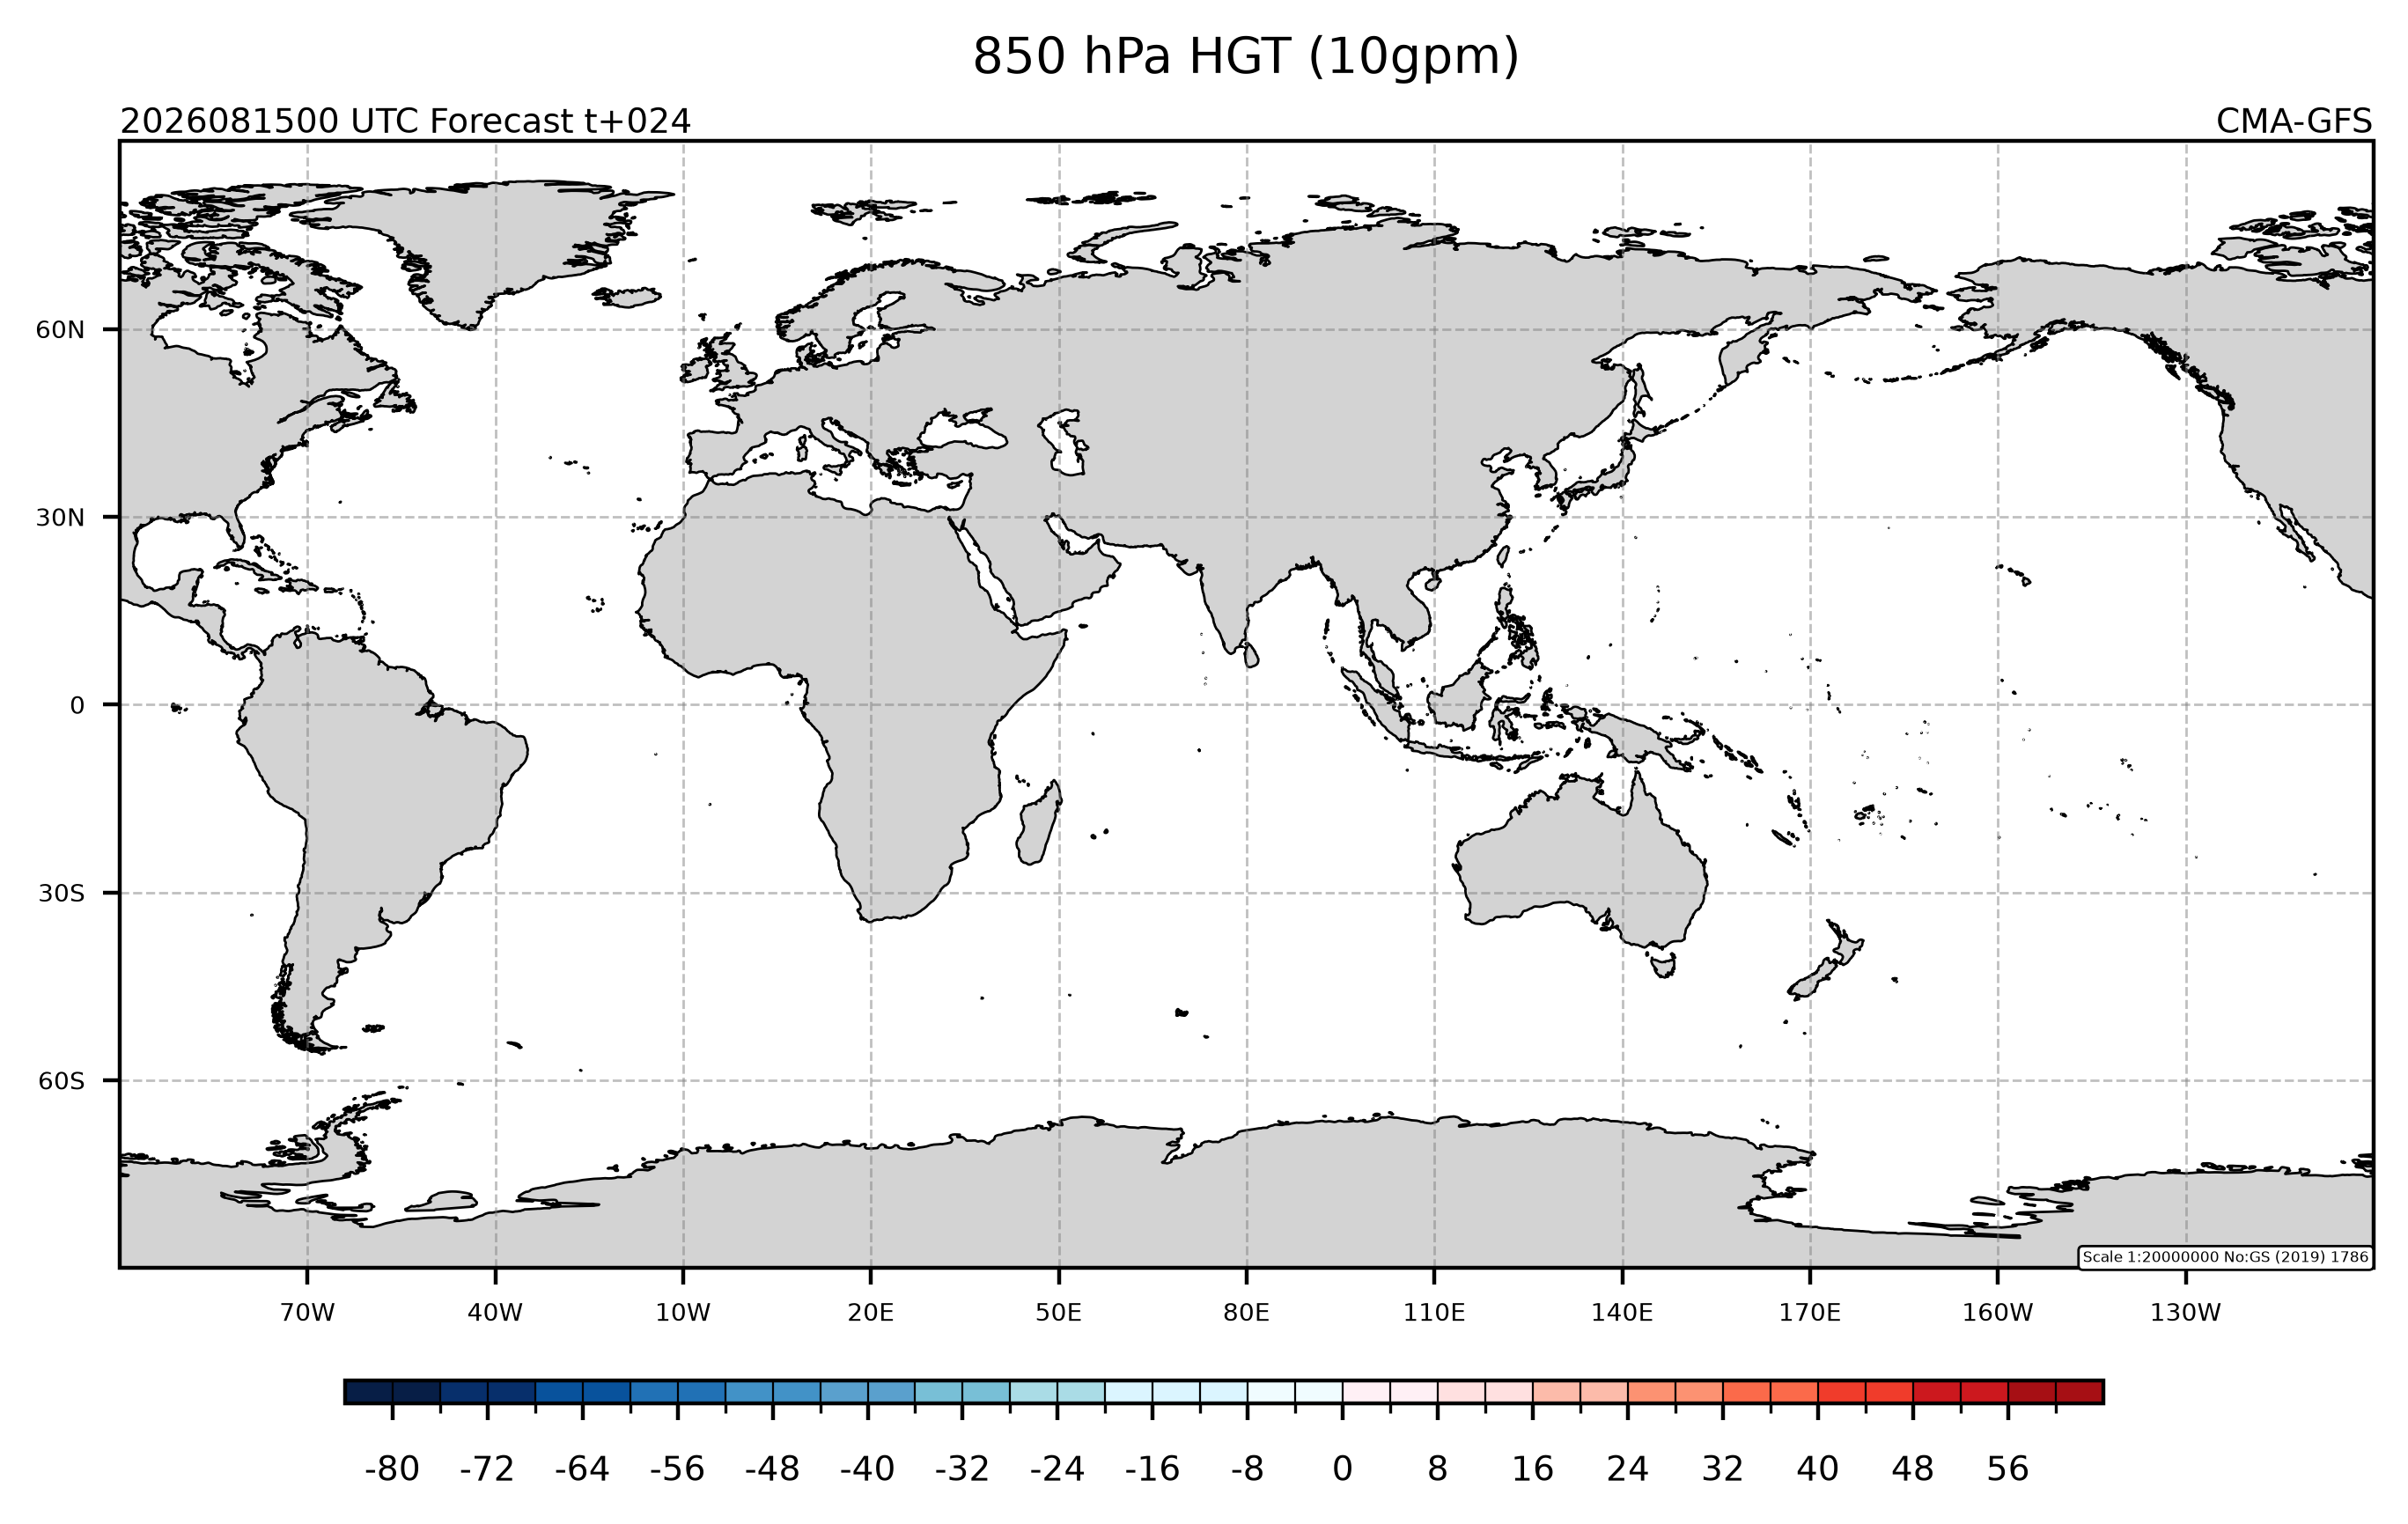
全球底图布局 (cedarkit.plots.domains.GlobalMapTemplate) 绘制全球范围图形,使用简易圆柱投影 (cartopy.crs.PlateCarree),默认中心经度东经 80 度。
默认使用 Cartopy 的底图,并填充陆地颜色。
准备
导入需要的包
import pandas as pd
import numpy as np

from cedarkit.plots.chart import Panel
from cedarkit.plots.domains import GlobalMapTemplate
from cedarkit.plots.map import set_default_map_loader_package
from cedarkit.plots.style import ContourStyle, ColorbarStyle
from cedarkit.plots.colormap import get_ncl_colormap
start_time = pd.Timestamp.now().normalize() - pd.Timedelta(days=2)
forecast_time = pd.to_timedelta("24h")
设置使用 CEMC 地图包
set_default_map_loader_package("cedarkit.plots.map.cemc")'cedarkit.plots.map.cemc'定义绘图样式
t_contour_lev = np.arange(-80, 60 + 4, 4)
colormap = get_ncl_colormap(
    "temp_19lev", count=len(t_contour_lev) + 1, spread_start=0, spread_end=17)
t_style = ContourStyle(
    colors=colormap,
    levels=t_contour_lev,
    fill=True,
    colorbar_style=ColorbarStyle(
        label_levels=t_contour_lev[::2]
    )
)绘制
绘制底图布局
domain = GlobalMapTemplate()
panel = Panel(domain=domain)

domain.set_title(
    panel=panel,
    graph_name="850 hPa HGT (10gpm)",
    system_name="CMA-GFS",
    start_time=start_time,
    forecast_time=pd.Timedelta(hours=24),
)
domain.add_colorbar(panel, style=t_style)

panel.show()