填充图#
本节介绍如何使用 cedarkit-maps 绘制 850 hPa 风速填充图。
首先导入需要使用的包。包括:
数据结构:numpy, pandas
cedarkit 工具套件
数据准备:reki
数据查找函数:
find_local_fileGRIB2文件要素加载函数:
load_field_from_file
气象可视化:cedarkit.maps
绘图板:
Panel底图布局:
EastAsiaMapDomain绘图样式:
ContourStyle颜色表加载函数:
get_ncl_colormap
import numpy as np
import pandas as pd

from reki.data_finder import find_local_file
from reki.format.grib.eccodes import load_field_from_file

from cedarkit.maps.style import ContourStyle
from cedarkit.maps.chart import Panel
from cedarkit.maps.domains import EastAsiaMapTemplate
from cedarkit.maps.colormap import get_ncl_colormap
设置绘图的数据参数,使用 CMA-GFS 2024 年 11 月 14 日 00 时次 024 数据。
system_name = "CMA-GFS"
data_type = "cma_gfs_gmf/grib2/orig"
start_time = pd.to_datetime("2024-11-14 00:00:00")
forecast_time = pd.to_timedelta("24h")
加载数据#
获取 GRIB2 数据路径
file_path = find_local_file(
    data_type,
    start_time=start_time,
    forecast_time=forecast_time,
)
file_path
PosixPath('/g3/COMMONDATA/OPER/CEMC/GFS_GMF/Prod-grib/2024111400/ORIG/gmf.gra.2024111400024.grb2')
加载 850 hPa 风场。风场在 ecCodes 的内置要素名为 u 和 v
u_850_field = load_field_from_file(
    file_path,
    parameter="u",
    level_type="pl",
    level=850
)
v_850_field = load_field_from_file(
    file_path,
    parameter="v",
    level_type="pl",
    level=850
)
u_850_field
<xarray.DataArray 'u' (latitude: 1440, longitude: 2880)> Size: 33MB
array([[-3.42031738, -3.42031738, -3.42031738, ..., -3.42031738,
        -3.42031738, -3.42031738],
       [-1.61031738, -1.61031738, -1.61031738, ..., -1.61031738,
        -1.61031738, -1.61031738],
       [-1.77031738, -1.77031738, -1.77031738, ..., -1.77031738,
        -1.77031738, -1.77031738],
       ...,
       [-2.60031738, -2.59031738, -2.58031738, ..., -2.63031738,
        -2.62031738, -2.61031738],
       [-2.63031738, -2.62031738, -2.62031738, ..., -2.69031738,
        -2.67031738, -2.65031738],
       [-2.77031738, -2.79031738, -2.81031738, ..., -2.86031738,
        -2.85031738, -2.81031738]])
Coordinates:
    time        datetime64[ns] 8B 2024-11-14
    step        timedelta64[ns] 8B 1 days
    valid_time  datetime64[ns] 8B 2024-11-15
    pl          float64 8B 850.0
  * latitude    (latitude) float64 12kB 89.94 89.81 89.69 ... -89.81 -89.94
  * longitude   (longitude) float64 23kB 0.0 0.125 0.25 ... 359.6 359.8 359.9
Attributes: (12/17)
    GRIB_edition:             2
    GRIB_centre:              babj
    GRIB_subCentre:           0
    GRIB_tablesVersion:       4
    GRIB_localTablesVersion:  0
    GRIB_dataType:            fc
    ...                       ...
    GRIB_stepType:            instant
    GRIB_stepUnits:           1
    GRIB_stepRange:           24
    GRIB_endStep:int:         24
    GRIB_count:               149
long_name: discipline=0 parmcat=2 parm=2计算得到风速场
wind_speed_850_field = np.sqrt(u_850_field ** 2 + v_850_field ** 2)
wind_speed_850_field
<xarray.DataArray (latitude: 1440, longitude: 2880)> Size: 33MB
array([[3.49408509, 3.49408509, 3.49408509, ..., 3.49005204, 3.49205483,
        3.49205483],
       [1.74963728, 1.74963728, 1.75357187, ..., 1.7457511 , 1.74963728,
        1.74963728],
       [1.82519138, 1.82519138, 1.82519138, ..., 1.82519138, 1.82519138,
        1.82519138],
       ...,
       [5.98069046, 6.03950877, 6.03522657, ..., 6.05677237, 6.03441402,
        6.03007846],
       [5.77019667, 5.91757894, 5.90861441, ..., 5.98460945, 5.95776006,
        5.94882276],
       [4.65091124, 4.75143846, 4.75514078, ..., 4.80894422, 4.80300303,
        4.77937368]])
Coordinates:
    time        datetime64[ns] 8B 2024-11-14
    step        timedelta64[ns] 8B 1 days
    valid_time  datetime64[ns] 8B 2024-11-15
    pl          float64 8B 850.0
  * latitude    (latitude) float64 12kB 89.94 89.81 89.69 ... -89.81 -89.94
* longitude (longitude) float64 23kB 0.0 0.125 0.25 ... 359.6 359.8 359.9配置#
定义填充图层次
wind_speed_contour_lev = np.arange(8, 26, 2)
定义填充图色表
color_index = np.arange(90, 236, 15) - 2
color_index[0] = -1
wind_speed_color_map = get_ncl_colormap(
    "rainbow+white+gray", index=color_index
)
定义填充图样式 (ContourStyle)
wind_speed_style = ContourStyle(
    colors=wind_speed_color_map,
    levels=wind_speed_contour_lev,
    fill=True,
)
绘制#
创建中国区域底图布局
domain = EastAsiaMapTemplate()
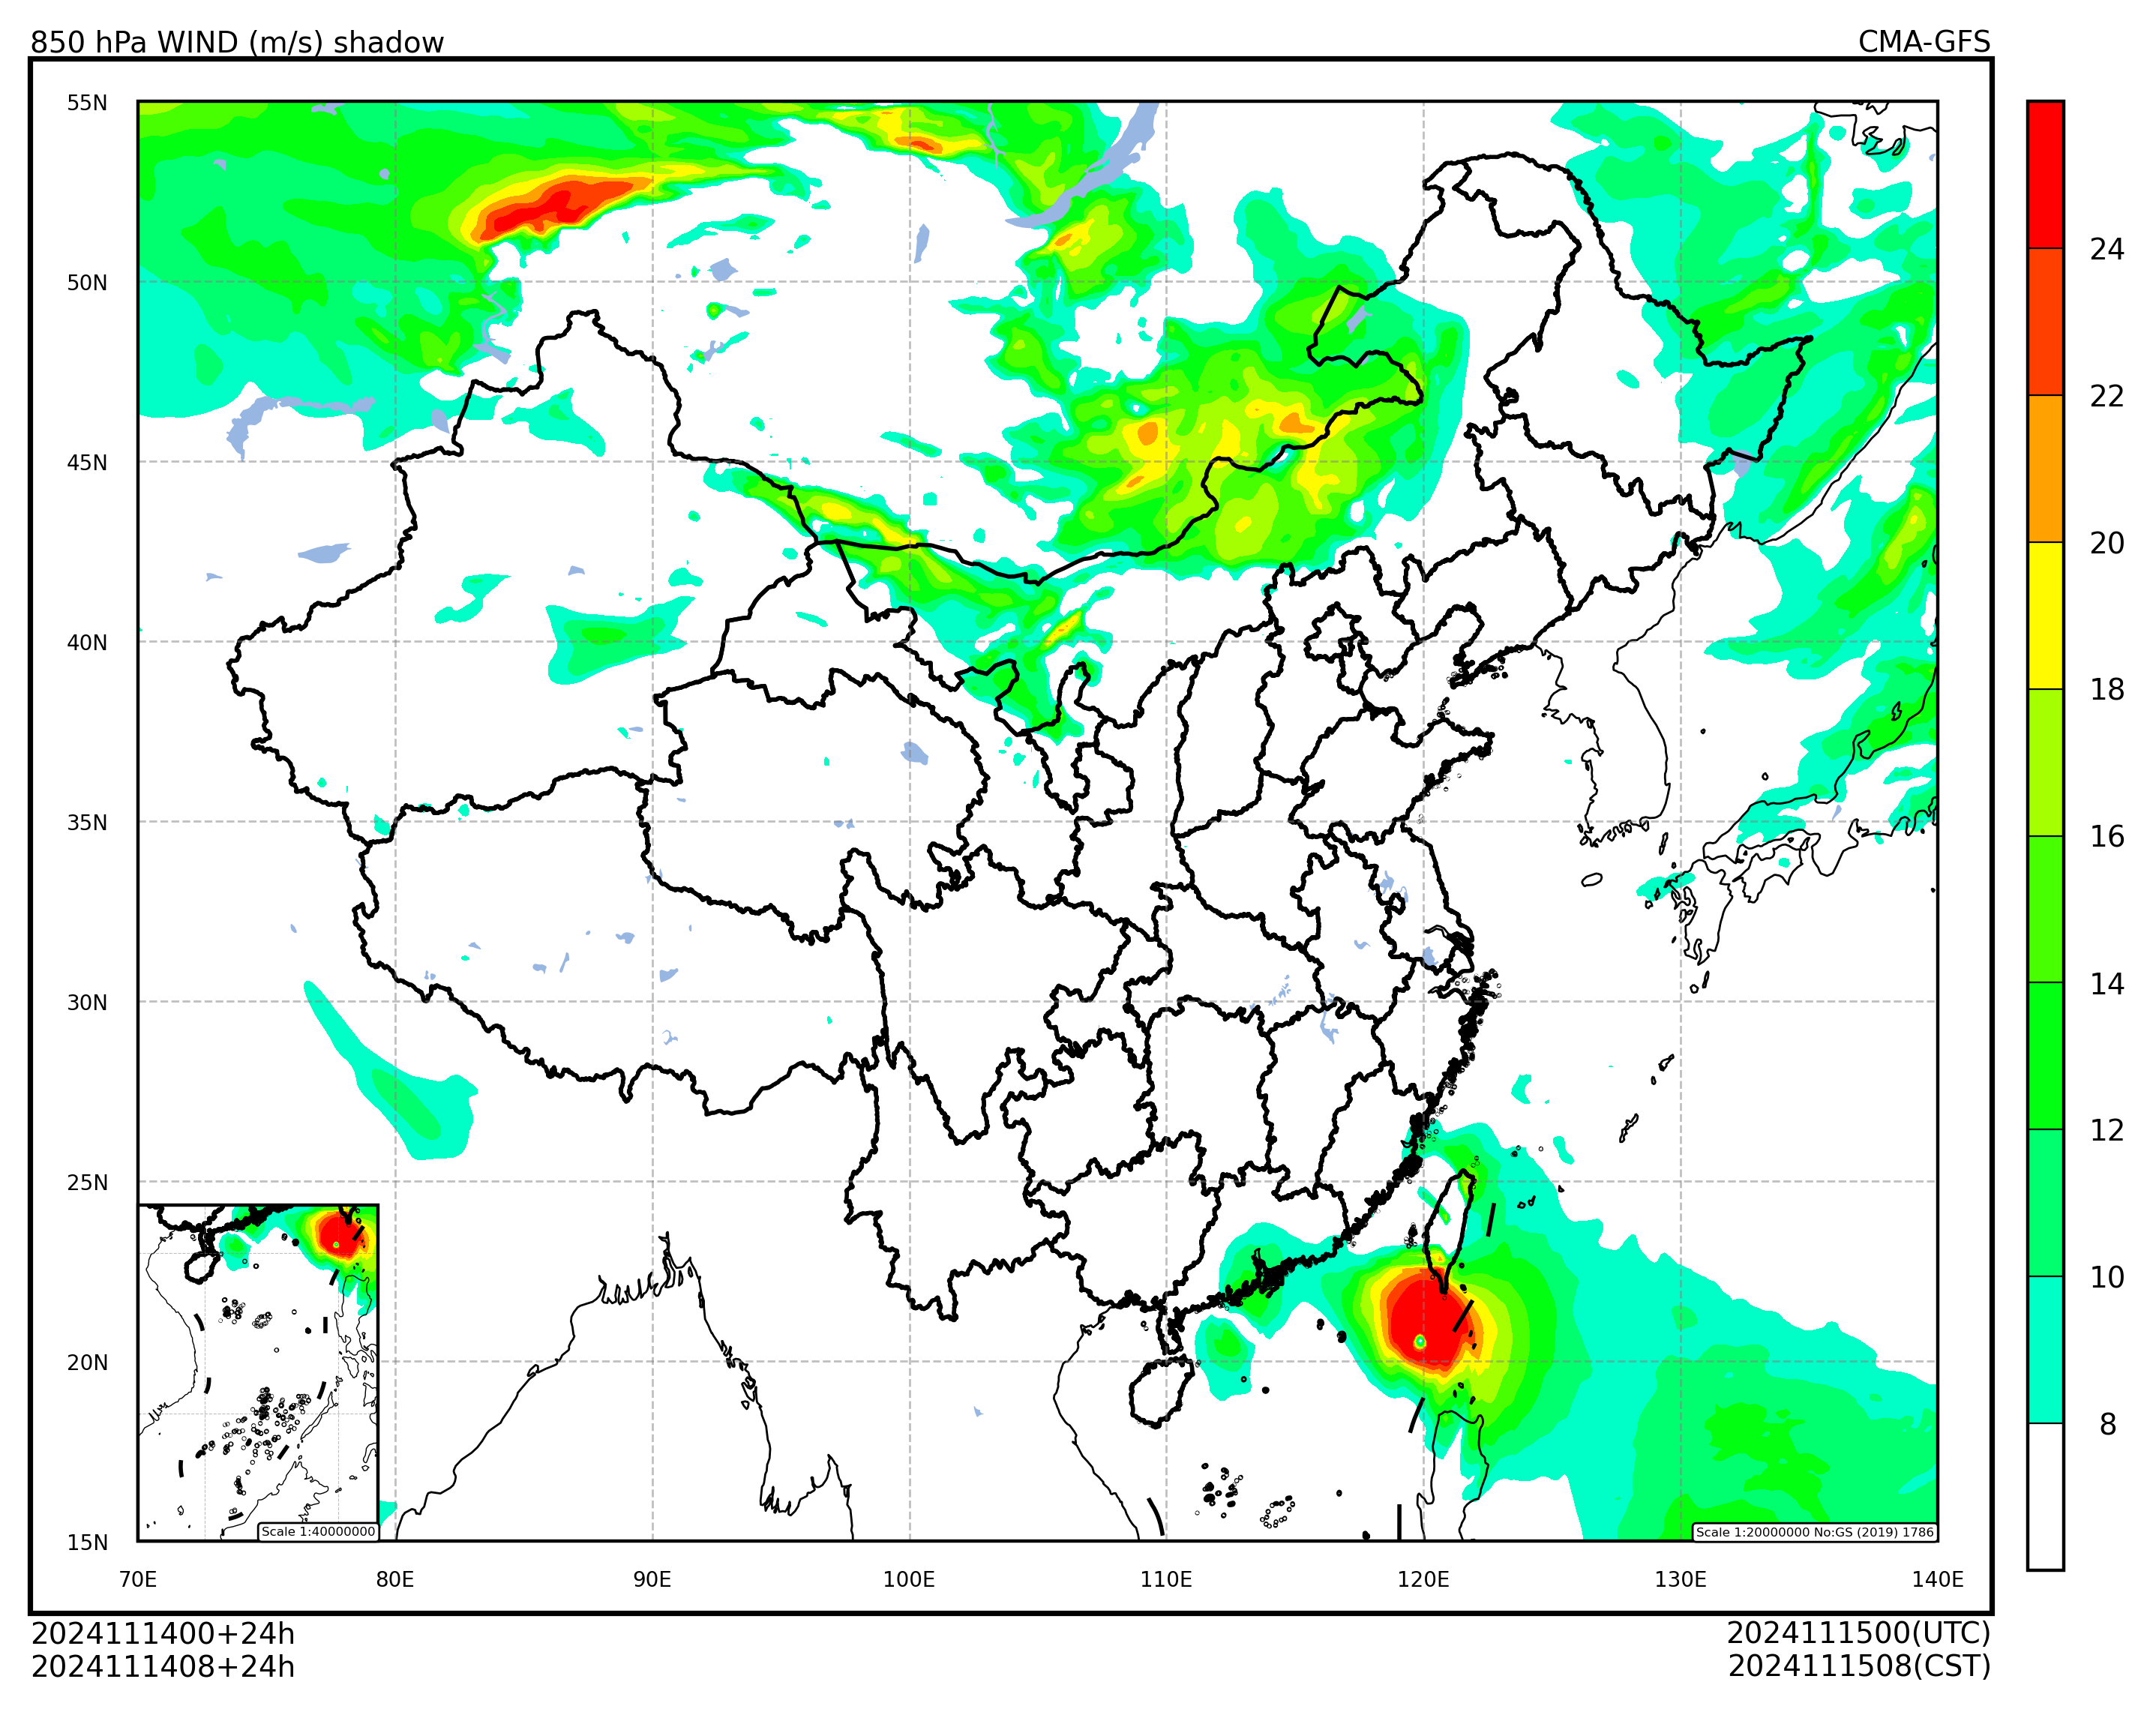
绘制填充图,设置标题和颜色条
panel = Panel(domain=domain)
panel.plot(wind_speed_850_field, style=wind_speed_style)

domain.set_title(
    panel=panel,
    graph_name="850 hPa WIND (m/s) shadow",
    system_name=system_name,
    start_time=start_time,
    forecast_time=forecast_time,
)
domain.add_colorbar(panel=panel, style=wind_speed_style)
panel.show()