风场图#
本节介绍如何使用 cedarkit-maps 绘制 850 hPa 风场图。
首先导入需要使用的包。包括:
数据结构:numpy, pandas
可视化:matplotlib
cedarkit 工具套件
数据准备:reki
数据查找函数:
find_local_fileGRIB2文件要素加载函数:
load_field_from_file
气象可视化:cedarkit.maps
绘图板:
Panel底图布局:
EastAsiaMapDomain绘图样式:
BarbStyle
import pandas as pd

from reki.data_finder import find_local_file
from reki.format.grib.eccodes import load_field_from_file

from cedarkit.maps.style import BarbStyle
from cedarkit.maps.chart import Panel
from cedarkit.maps.domains import EastAsiaMapTemplate
设置绘图的数据参数,使用 CMA-GFS 2024 年 11 月 14 日 00 时次 024 时效数据。
system_name = "CMA-GFS"
data_type = "cma_gfs_gmf/grib2/orig"
start_time = pd.to_datetime("2024-11-14 00:00:00")
forecast_time = pd.to_timedelta("24h")
加载数据#
获取 GRIB2 数据路径
file_path = find_local_file(
    data_type,
    start_time=start_time,
    forecast_time=forecast_time,
)
file_path
PosixPath('/g3/COMMONDATA/OPER/CEMC/GFS_GMF/Prod-grib/2024111400/ORIG/gmf.gra.2024111400024.grb2')
加载 850 hPa 风场。风场在 ecCodes 的内置要素名为 u 和 v
u_850_field = load_field_from_file(
    file_path,
    parameter="u",
    level_type="pl",
    level=850
)
v_850_field = load_field_from_file(
    file_path,
    parameter="v",
    level_type="pl",
    level=850
)
v_850_field
<xarray.DataArray 'v' (latitude: 1440, longitude: 2880)> Size: 33MB
array([[ 0.71418457,  0.71418457,  0.71418457, ...,  0.69418457,
         0.70418457,  0.70418457],
       [ 0.68418457,  0.68418457,  0.69418457, ...,  0.67418457,
         0.68418457,  0.68418457],
       [ 0.44418457,  0.44418457,  0.44418457, ...,  0.44418457,
         0.44418457,  0.44418457],
       ...,
       [-5.38581543, -5.45581543, -5.45581543, ..., -5.45581543,
        -5.43581543, -5.43581543],
       [-5.13581543, -5.30581543, -5.29581543, ..., -5.34581543,
        -5.32581543, -5.32581543],
       [-3.73581543, -3.84581543, -3.83581543, ..., -3.86581543,
        -3.86581543, -3.86581543]])
Coordinates:
    time        datetime64[ns] 8B 2024-11-14
    step        timedelta64[ns] 8B 1 days
    valid_time  datetime64[ns] 8B 2024-11-15
    pl          float64 8B 850.0
  * latitude    (latitude) float64 12kB 89.94 89.81 89.69 ... -89.81 -89.94
  * longitude   (longitude) float64 23kB 0.0 0.125 0.25 ... 359.6 359.8 359.9
Attributes: (12/17)
    GRIB_edition:             2
    GRIB_centre:              babj
    GRIB_subCentre:           0
    GRIB_tablesVersion:       4
    GRIB_localTablesVersion:  0
    GRIB_dataType:            fc
    ...                       ...
    GRIB_stepType:            instant
    GRIB_stepUnits:           1
    GRIB_stepRange:           24
    GRIB_endStep:int:         24
    GRIB_count:               189
long_name: discipline=0 parmcat=2 parm=3配置#
定义风场图样式 (BarbStyle)
wind_barb_style = BarbStyle(
    barbcolor="red",
    flagcolor="red",
    linewidth=0.3,
)
绘制#
创建中国区域底图布局
domain = EastAsiaMapTemplate()
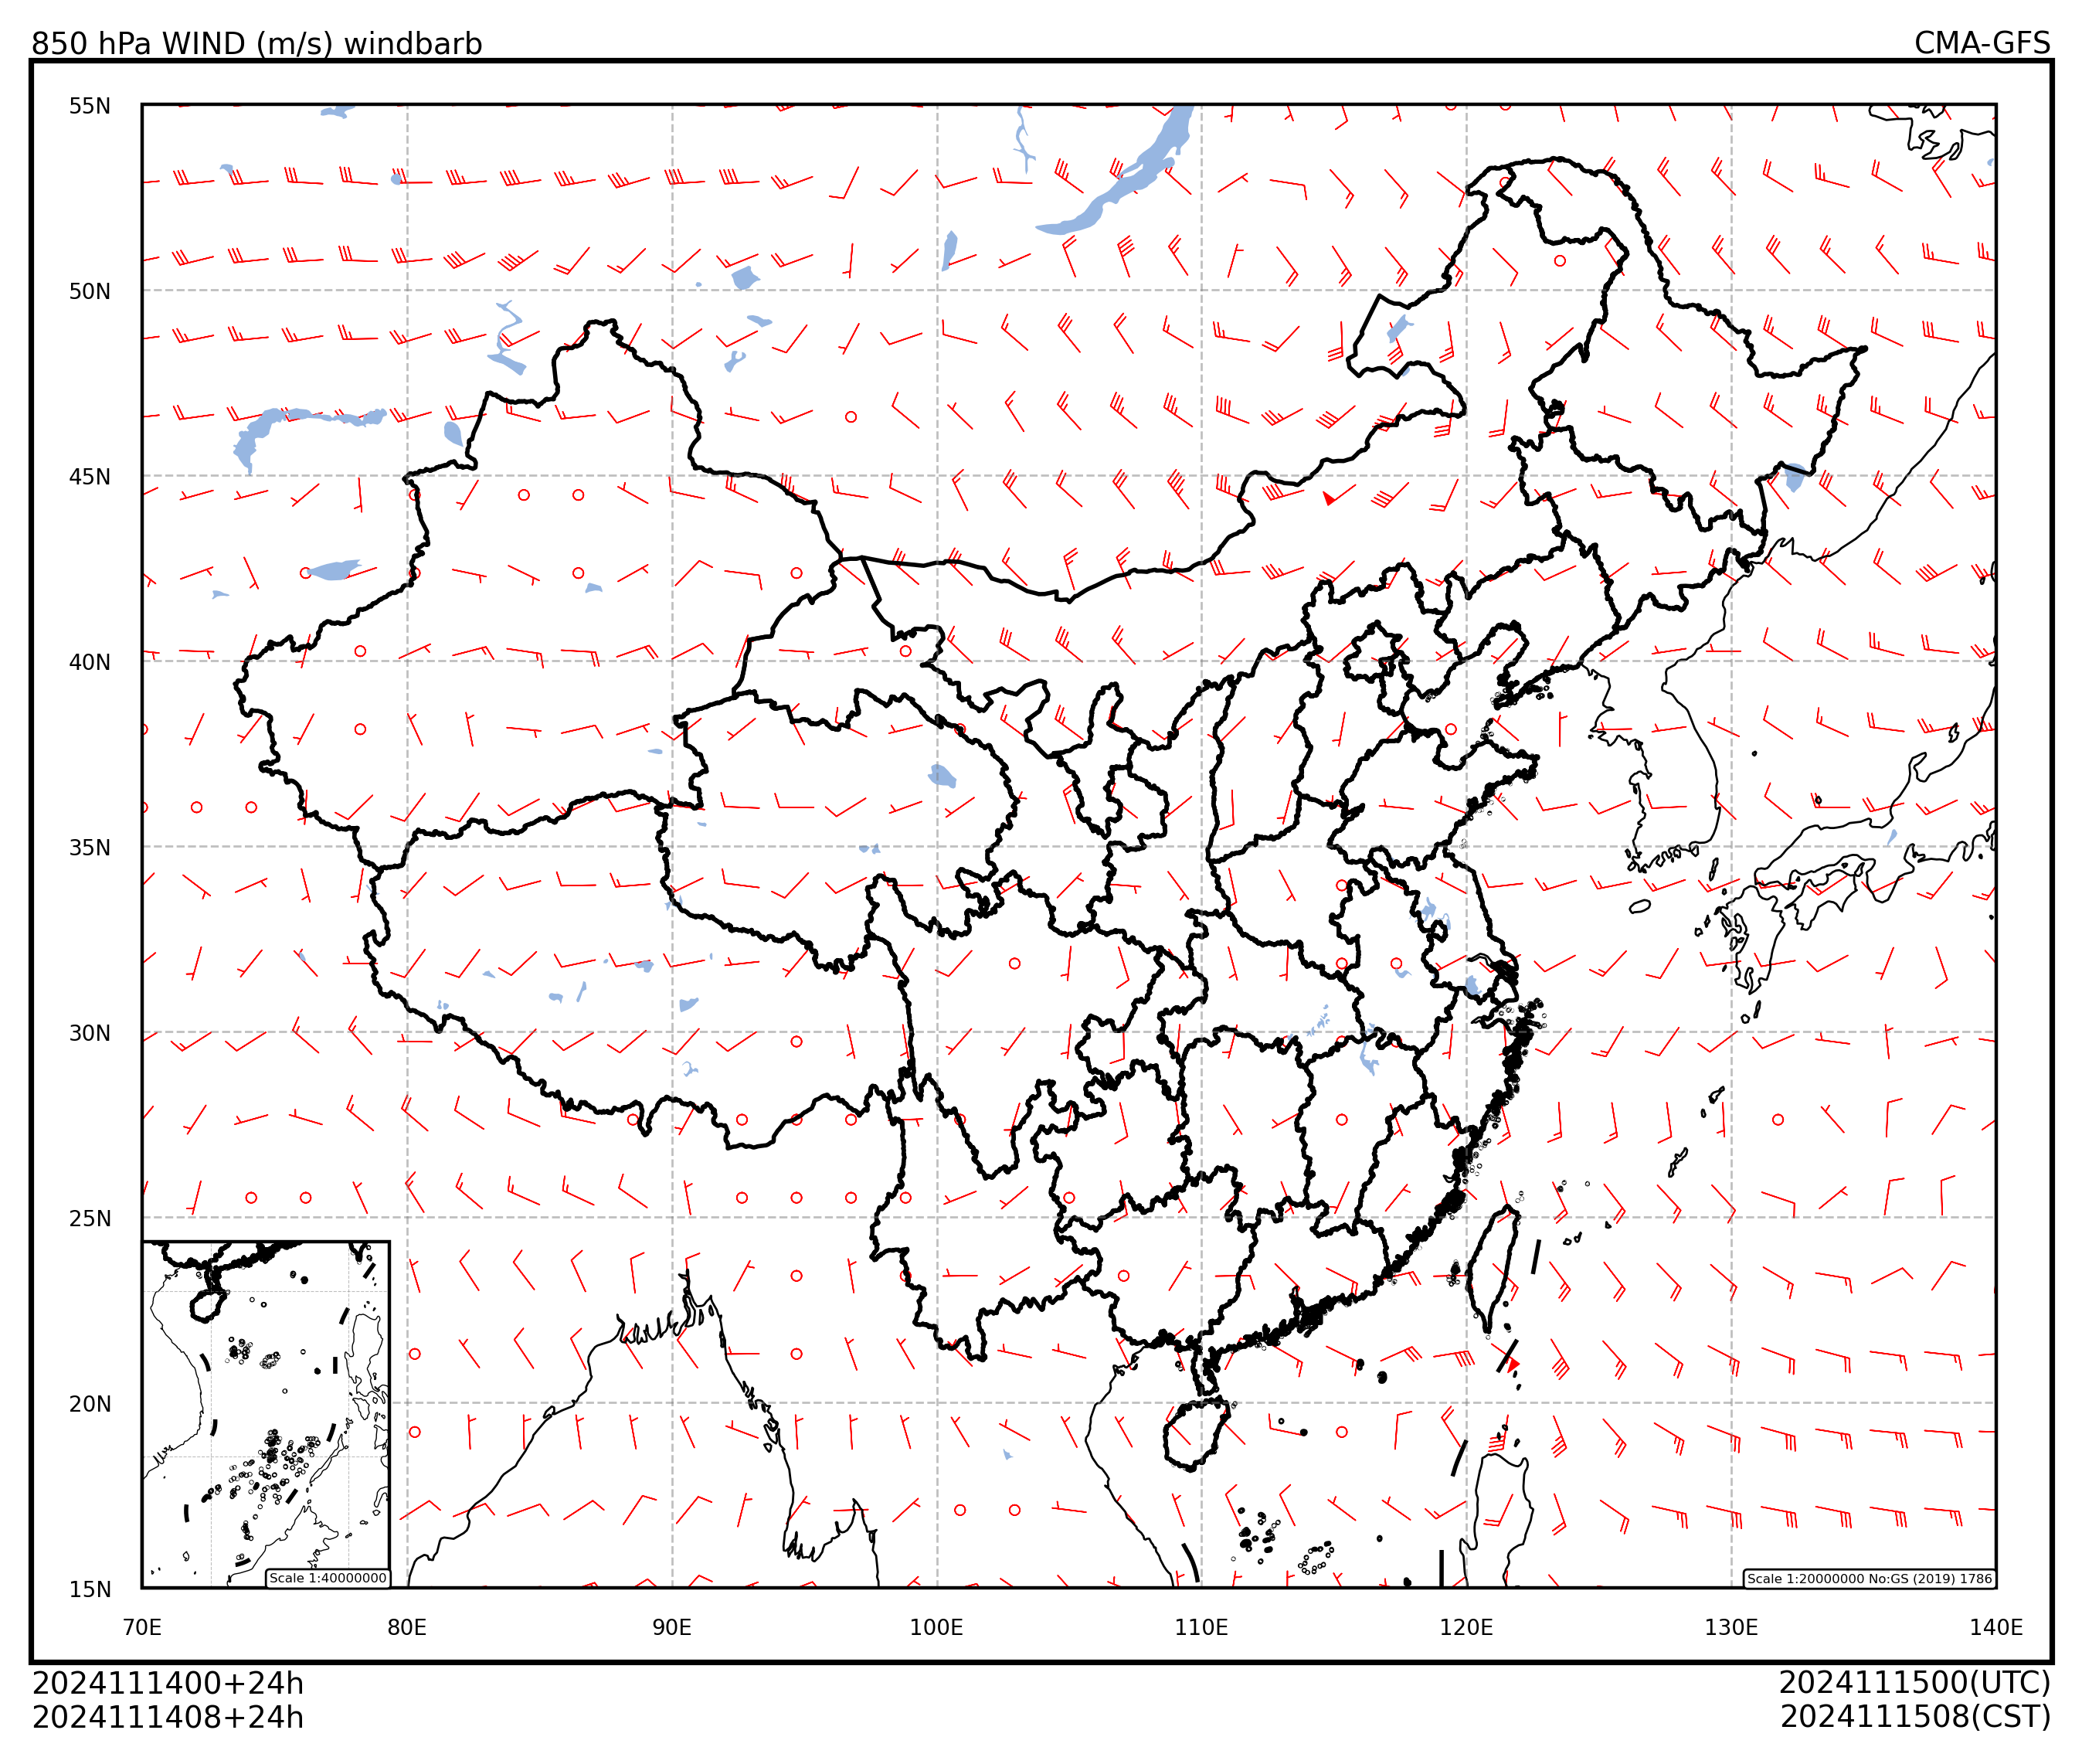
绘图风场图,设置标题。
注:这里将风场稀疏化后再绘图,并只在主区域(第 1 层)绘图,即
layer=[0]
panel = Panel(domain=domain)
panel.plot([[u_850_field[::14, ::14], v_850_field[::14, ::14]]], style=wind_barb_style, layer=[0])

domain.set_title(
    panel=panel,
    graph_name="850 hPa WIND (m/s) windbarb",
    system_name=system_name,
    start_time=start_time,
    forecast_time=forecast_time,
)
panel.show()