天擎大数据云平台 CMADaaS 使用 MUSIC 接口用于检索数据,提供包括 Python 在内的多种编程语言 SDK,详情请访问天擎门户网站 开发SDK 栏目。
因天擎 MUSIC SDK 仅内网使用,本文介绍仿照 MUSIC SDK 重新实现的 MUSIC Python 接口库 nuwe-cmadaas-python。
安装
nuwe-cmadaas-python 库尚未发布到 PYPI 中,请从 GitHub 项目库中下载最新代码并使用 pip 安装。
仓库地址: https://
git clone https://github.com/perillaroc/nuwe-cmadaas-python.git
cd nuwe-cmadaas-python
pip install .配置
天擎平台检索数据需要准备账户,并申请资料的访问权限。
创建配置文件 ~/.config/cedarkit.yaml,配置访问天擎的服务器信息、账户名和密码,类似:
cmadaas:
  auth:
    user: user name
    password: user password
  server:
    music_server: music server ip
    music_port: music server port
    music_connTimeout: 3  # connection time out, seconds
    music_readTimeout: 3000  # read time out, seconds
    music_ServiceId: music service id
详细配置参数信息请查看天擎 MUSIC SDK 示例文件。
准备
导入需要的包
import xarray as xr
import pandas as pd
from nuwe_cmadaas.model import retrieve_model_grid
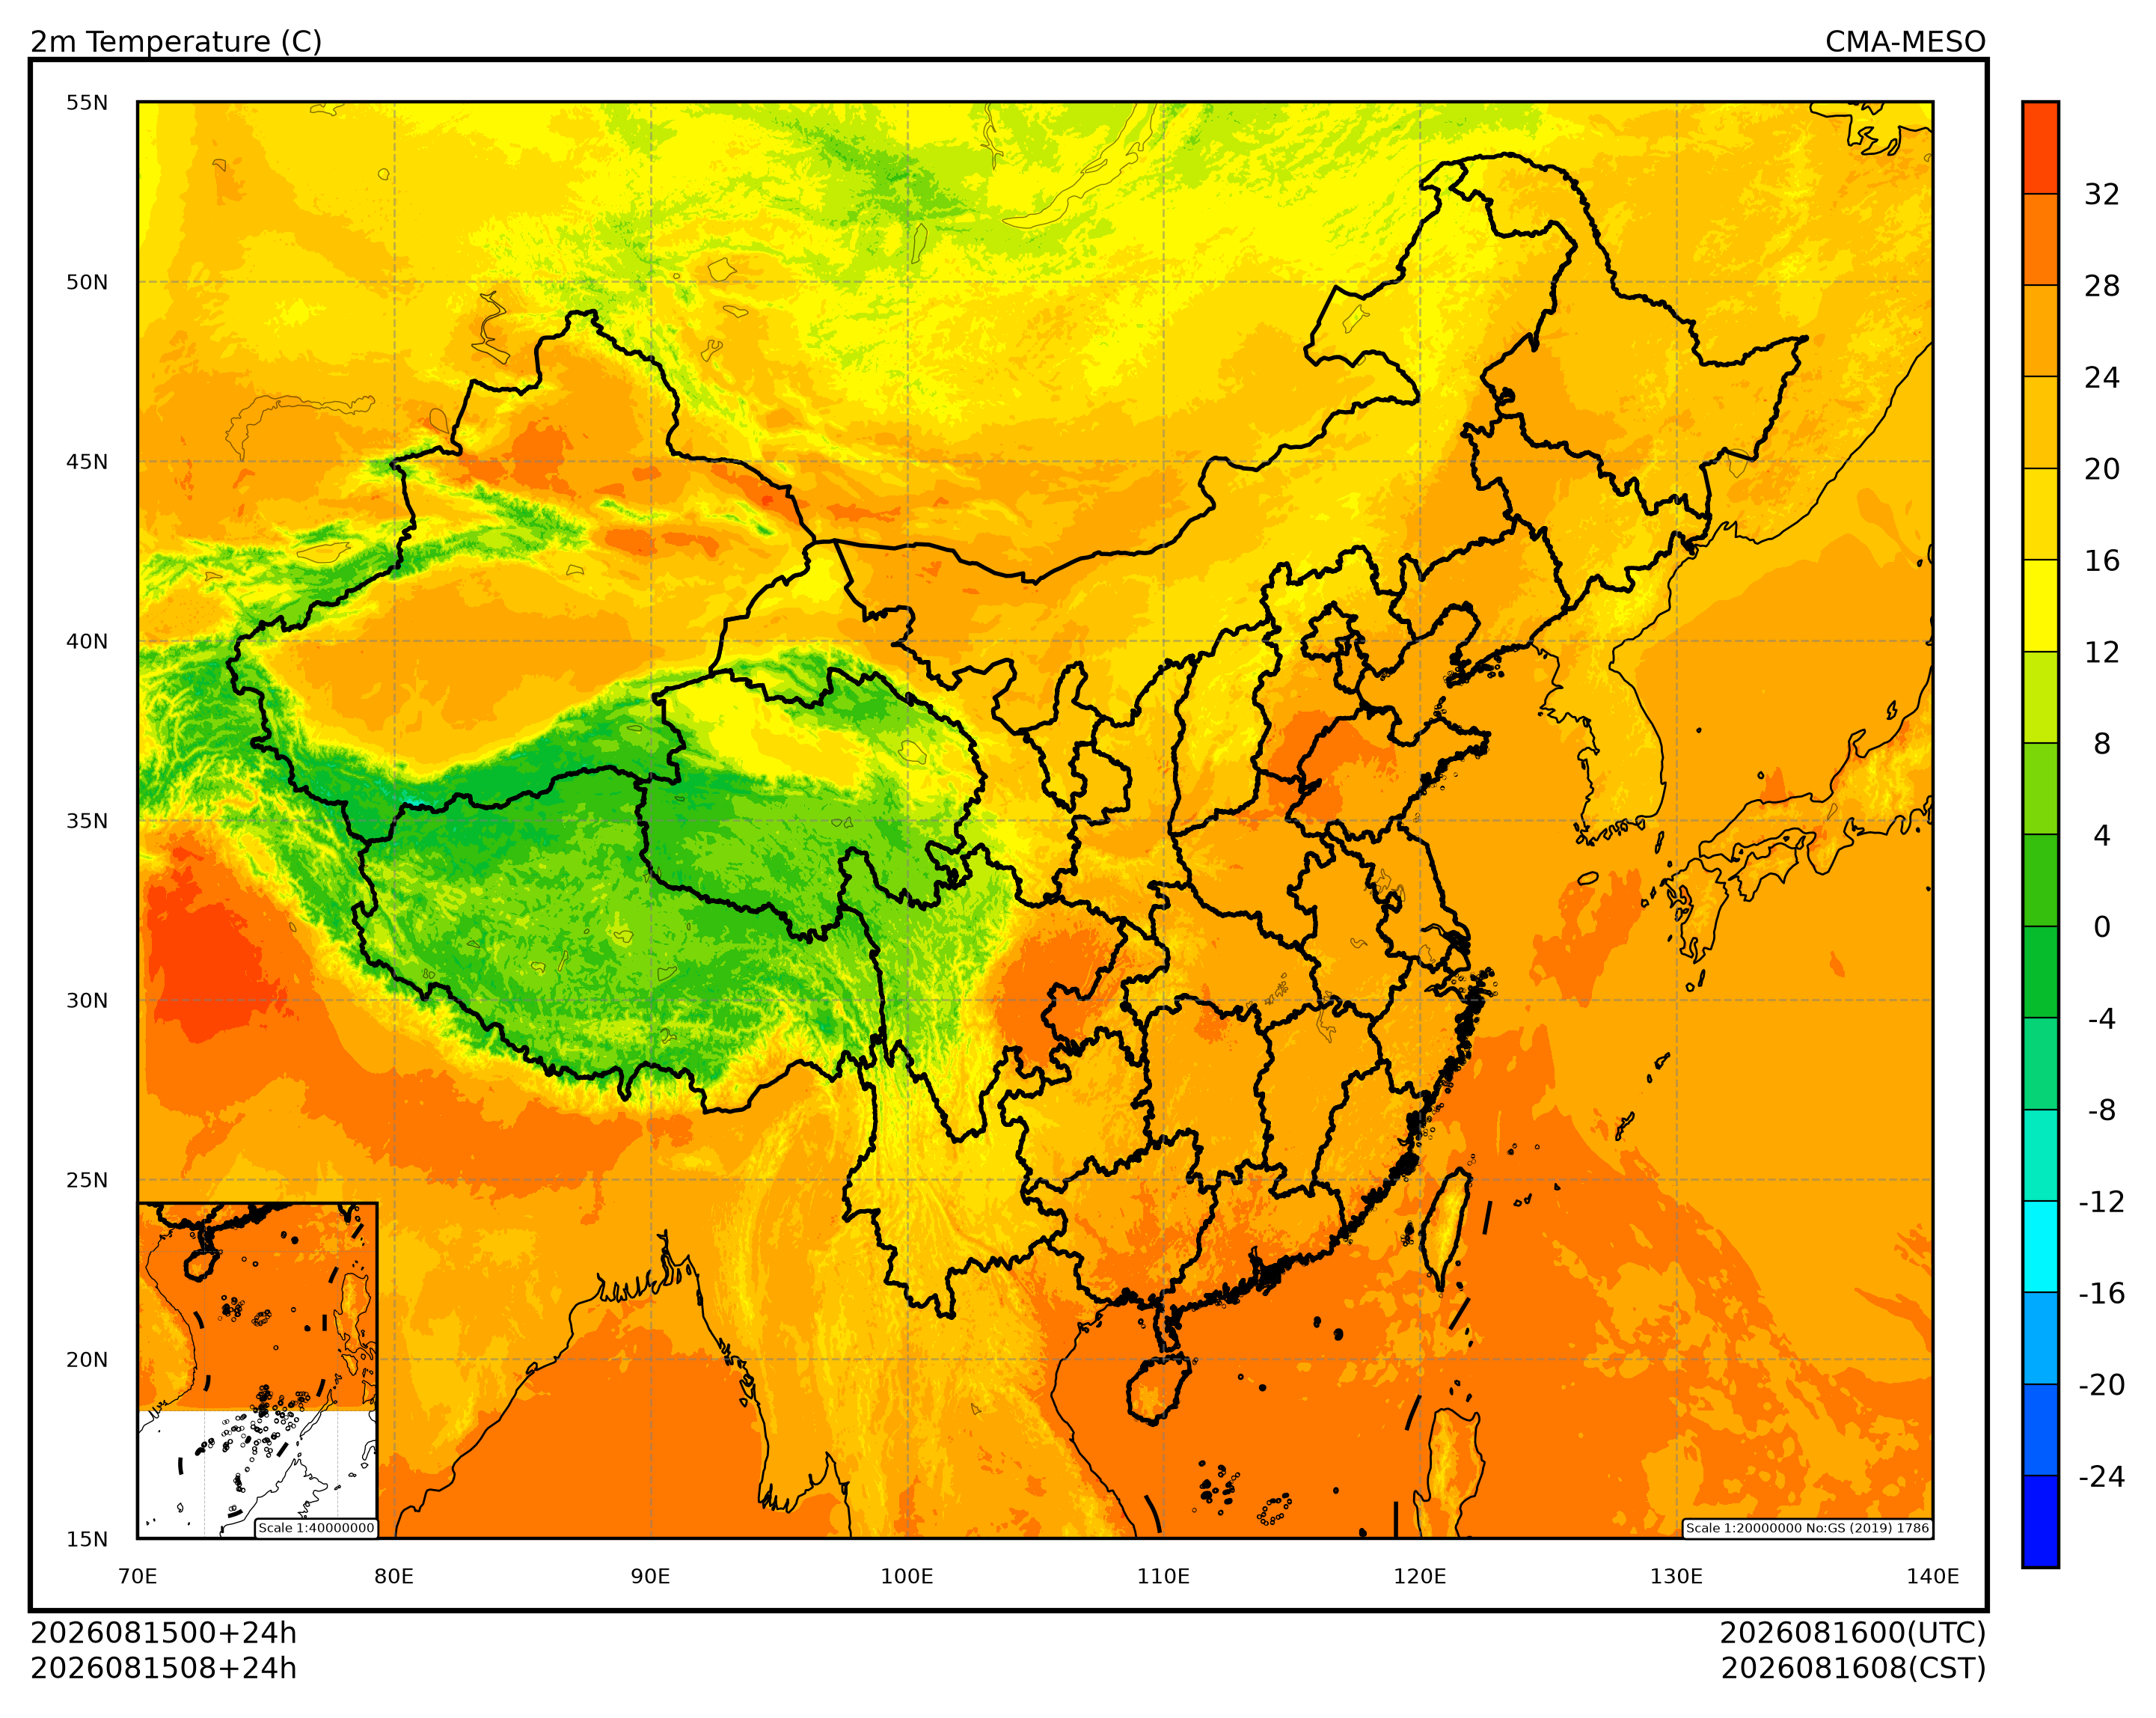
设置绘图的数据参数,使用 CMA-MESO 最近可获取的时次 024 时效数据。
天擎数据条目使用“中国气象局区域模式CMA-MESO原始分辨率预报产品(0.03×0.03)”,数据编码“NAFP_GRAPES_MESO_FOR_3KM”。
system_name = "CMA-MESO"
start_time = pd.Timestamp.now().normalize() - pd.Timedelta(days=2)
forecast_time = pd.to_timedelta("24h")

CMADAAS_DATA_ID = "NAFP_GRAPES_MESO_FOR_3KM"加载数据
加载 2 米温度场
参数解释:
paramter="TEM":气温level_type=103:特定高度层(地面以上),单位米level=2:2 米
更详细的数据说明请访问天擎门户网站的数据条目。
t_2m_field = retrieve_model_grid(
    CMADAAS_DATA_ID,
    start_time=start_time,
    forecast_time=forecast_time,
    parameter="TEM",
    level_type=103,
    level=2,
) - 273.15
t_2m_field
2026-08-17 15:26:00.394 | INFO | nuwe_cmadaas.model.grid:retrieve_model_grid:117 - interface_id: getNafpEleGridByTimeAndLevelAndValidtime
2026-08-17 15:26:00.396 | INFO | nuwe_cmadaas.music.client:_do_request:480 - fetch url: http://music.babj.cmadaas.cma:80/music-ws/api?serviceNodeId=NMIC_MUSIC_CMADAAS&method=callAPI_to_gridArray2D&userId=NMC_WANGDP&interfaceId=getNafpEleGridByTimeAndLevelAndValidtime&language=Python&clientversion=V2.0.0&dataCode=NAFP_GRAPES_MESO_FOR_3KM&fcstEle=TEM&levelType=103&fcstLevel=2&time=20260815000000&validTime=24×tamp=1786951560397&nonce=e56341d6-9a0c-11f1-aa54-f1225bd77b58&sign=707ED5F2BC65FE07AE0270866B8A64BE
Loading...
绘图
使用 cedarkit-plots 绘制 2 米温度填充图
Source
from cedarkit.plots.style import ContourStyle
from cedarkit.plots.chart import Panel
from cedarkit.plots.domains import EastAsiaMapTemplate
from cedarkit.plots.colormap import get_ncl_colormap

t_2m_level = [-24, -20, -16, -12, -8, -4, 0, 4, 8, 12, 16, 20, 24, 28, 32]
color_index = [2, 12, 22, 32, 42, 52, 62, 72, 82, 92, 102, 112, 122, 132, 142, 152]
t_2m_color_map = get_ncl_colormap("BlAqGrYeOrReVi200", index=color_index)
t_2m_style = ContourStyle(
    colors=t_2m_color_map,
    levels=t_2m_level,
    fill=True,
)
domain = EastAsiaMapTemplate()
panel = Panel(domain=domain)
panel.plot(t_2m_field, style=t_2m_style)
domain.set_title(
    panel=panel,
    graph_name="2m Temperature (C)",
    system_name=system_name,
    start_time=start_time,
    forecast_time=forecast_time,
)
domain.add_colorbar(panel=panel, style=t_2m_style)
panel.show()