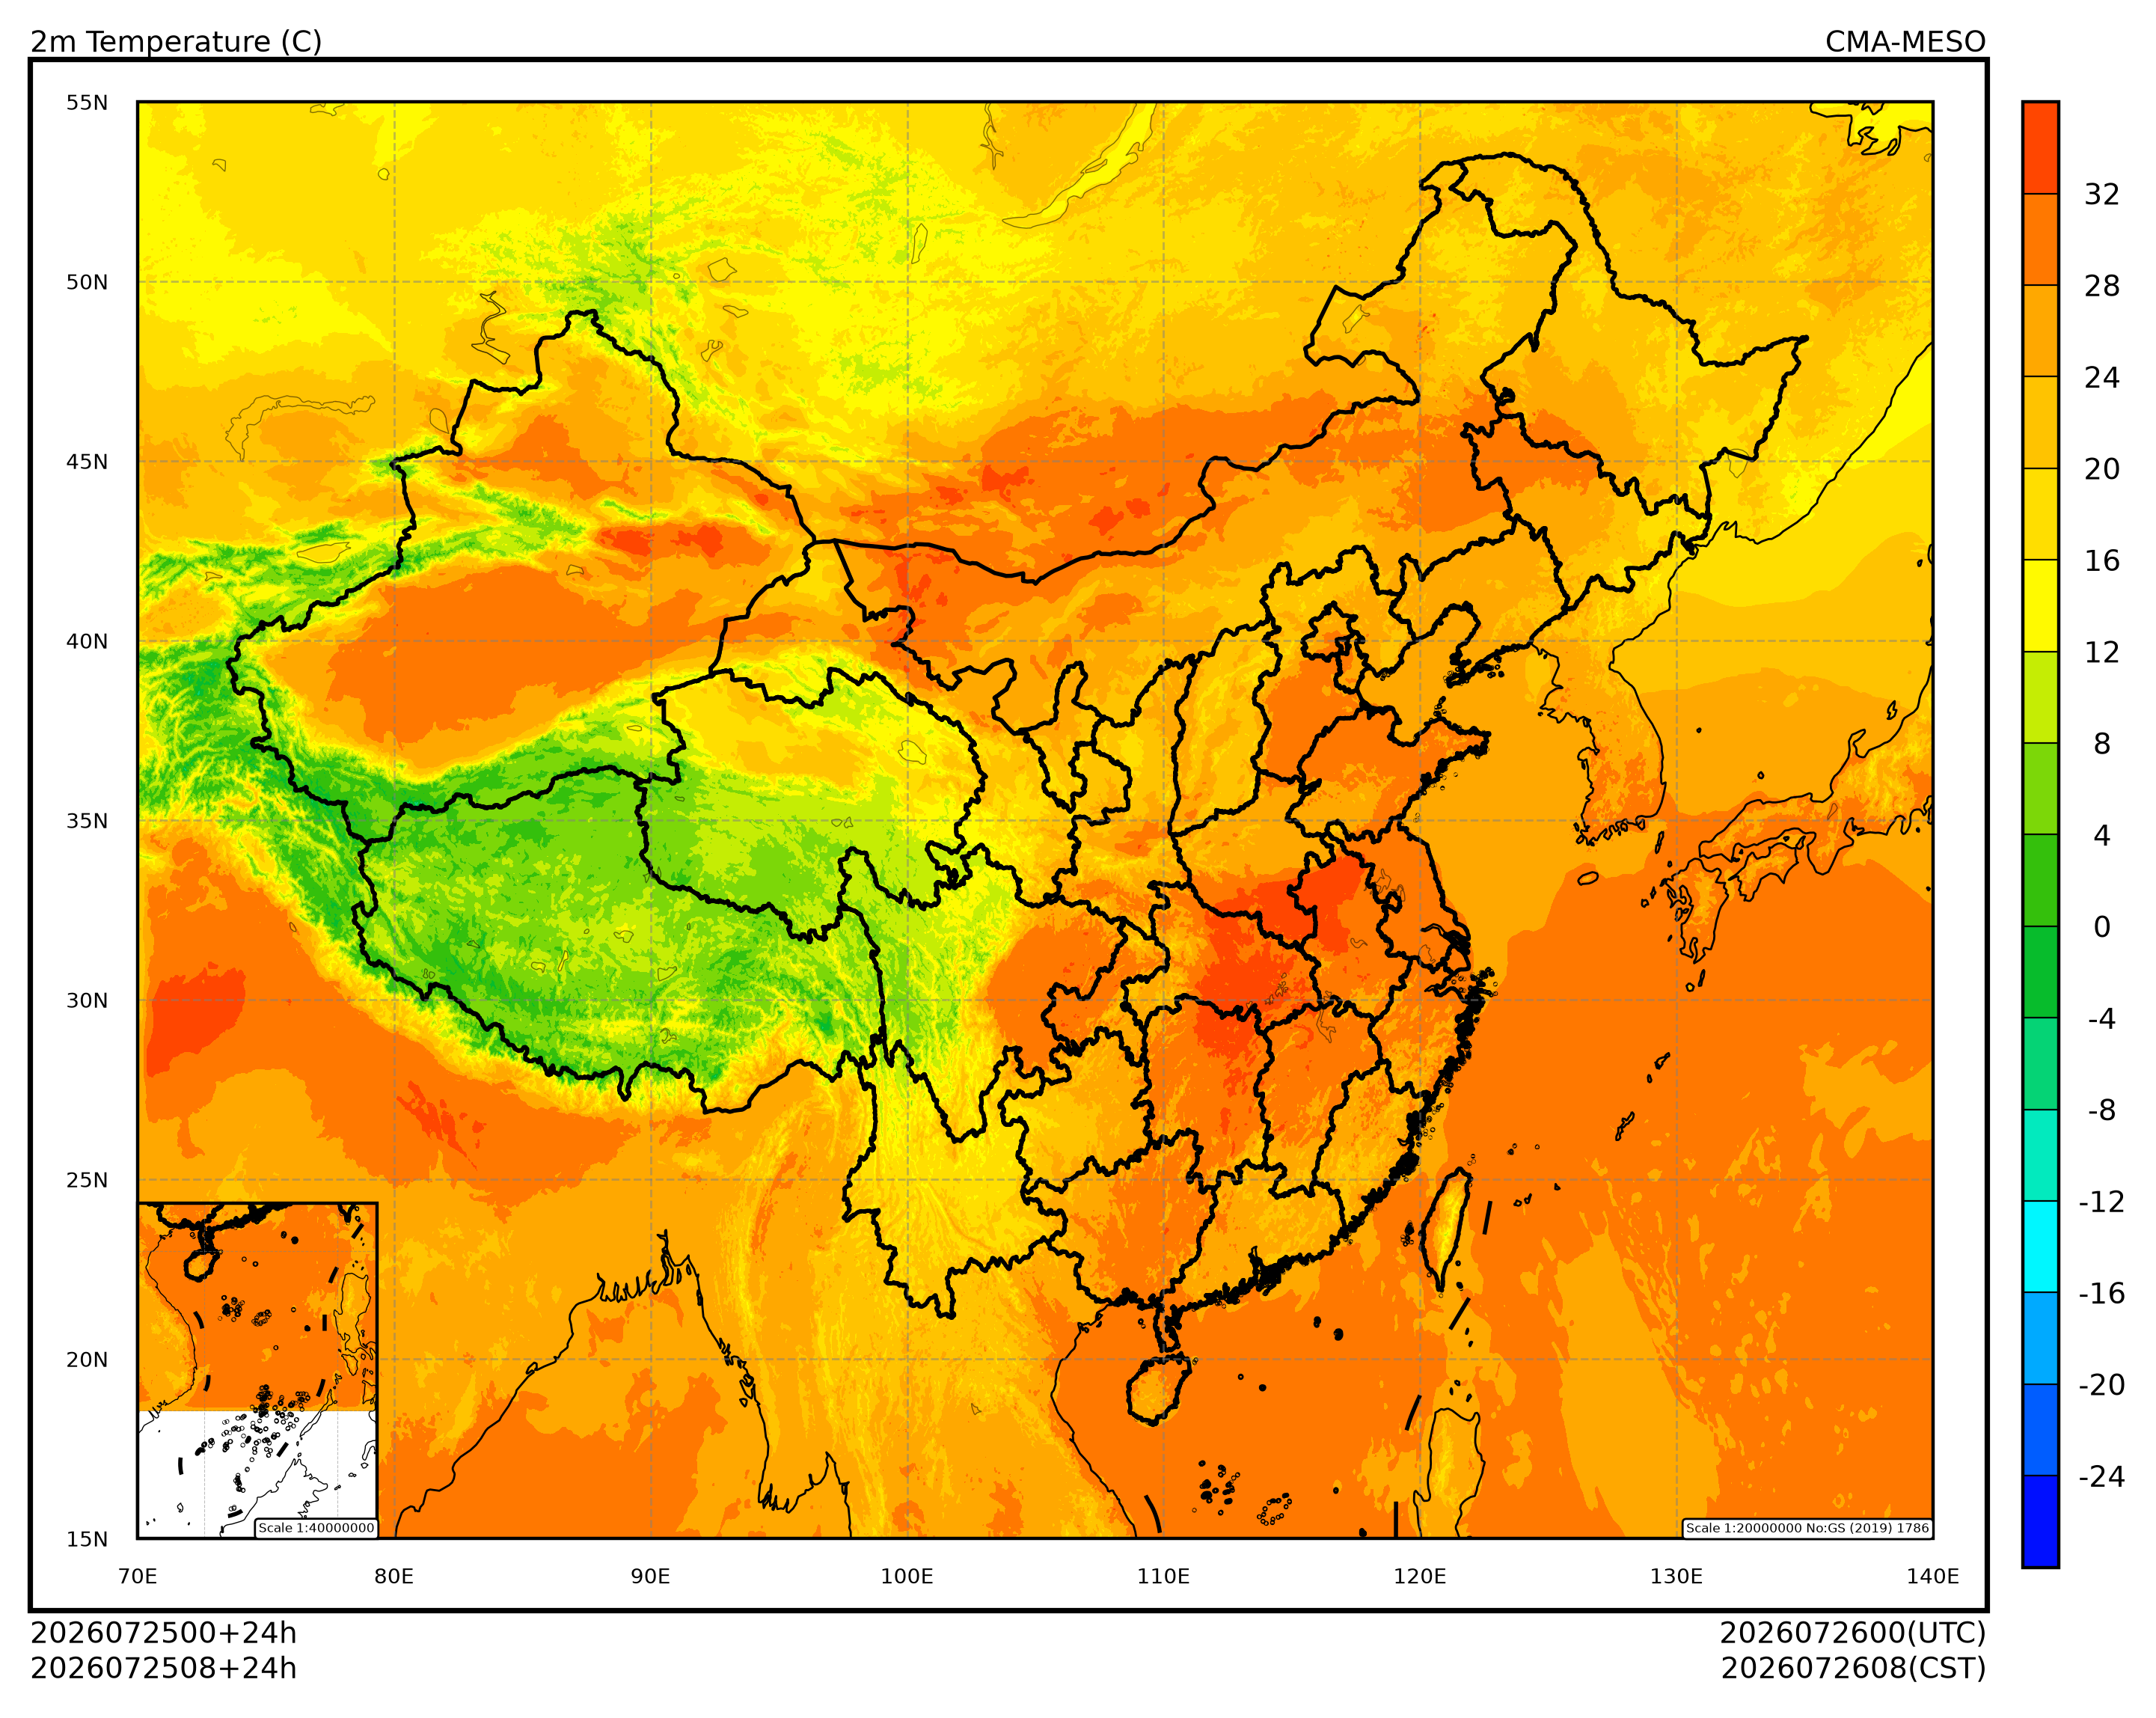
本节介绍如何使用 cfgrib 加载 GRIB2 要素场,并使用 cedarkit-plots 绘图。
安装
使用 conda 安装 cfgrib
conda install -c conda-forge cfgrib准备
导入需要的包
import xarray as xr
import pandas as pd
import cfgrib

# 数据环境配置:使用本地数据目录(可用环境变量 CEDARKIT_NOTEBOOK_DATA_ROOT 覆盖)
from cedarkit_notebook.data import get_data_root, get_dataset_query
/home/wangdp/project/cedarkit/notebook-project/notebook-devel/repo/cedarkit-notebook-project/cedarkit-notebook/.venv/lib/python3.14/site-packages/gribapi/__init__.py:23: UserWarning: ecCodes 2.42.0 or higher is recommended. You are running version 2.34.1
warnings.warn(
DATA_CLASS = "cmadaas"
STORAGE_BASE = str(get_data_root())
设置绘图的数据参数,使用 CMA-MESO-3KM 最近可获取的时次 024 时效数据。
system_name = "CMA-MESO"
data_type = "cma_meso_3km/grib2/orig"
# 起报时次与预报时效固定为本地已下载数据(见 data/metadata/cma-meso-3km.yaml)
query = get_dataset_query("cma-meso-3km")
start_time = pd.to_datetime(query["start_time"], format="%Y%m%d%H")
forecast_time = pd.to_timedelta(query["forecast_time"])加载数据
设置 GRIB2 数据文件路径
from reki.data_finder import find_local_file

file_path = find_local_file(
    data_type,
    start_time=start_time,
    forecast_time=forecast_time,
    data_class=DATA_CLASS,
    storage_base=STORAGE_BASE
)
file_path
PosixPath('/home/wangdp/project/cedarkit/notebook-project/notebook-devel/repo/cedarkit-notebook-project/cedarkit-notebook/data/DATA/NAFP/GRAPES/RAFS/2026/20260725/Z_NAFP_C_BABJ_20260725000000_P_NWPC-GRAPES-3KM-ORIG-02400.grb2')使用 cfgrib 加载 2 米温度要素场。
说明:
index=""表示不生成 cfgrib 的索引文件filter_by_keys用于设置筛选要素场的条件,这里选择 shortName 为2t的场
ds = xr.open_dataset(
    file_path,
    engine="cfgrib",
    backend_kwargs={
        "filter_by_keys": {
            "shortName": "2t"
        },
        "indexpath": "",
    }
)
t_2m_field = ds["t2m"] - 273.15
t_2m_field
Loading...
绘图
使用 cedarkit-plots 绘制 2 米温度填充图
Source
from cedarkit.plots.style import ContourStyle
from cedarkit.plots.chart import Panel
from cedarkit.plots.domains import EastAsiaMapTemplate
from cedarkit.plots.colormap import get_ncl_colormap

t_2m_level = [-24, -20, -16, -12, -8, -4, 0, 4, 8, 12, 16, 20, 24, 28, 32]
color_index = [2, 12, 22, 32, 42, 52, 62, 72, 82, 92, 102, 112, 122, 132, 142, 152]
t_2m_color_map = get_ncl_colormap("BlAqGrYeOrReVi200", index=color_index)
t_2m_style = ContourStyle(
    colors=t_2m_color_map,
    levels=t_2m_level,
    fill=True,
)
domain = EastAsiaMapTemplate()
panel = Panel(domain=domain)
panel.plot(t_2m_field, style=t_2m_style)
domain.set_title(
    panel=panel,
    graph_name="2m Temperature (C)",
    system_name=system_name,
    start_time=start_time,
    forecast_time=forecast_time,
)
domain.add_colorbar(panel=panel, style=t_2m_style)
panel.show()