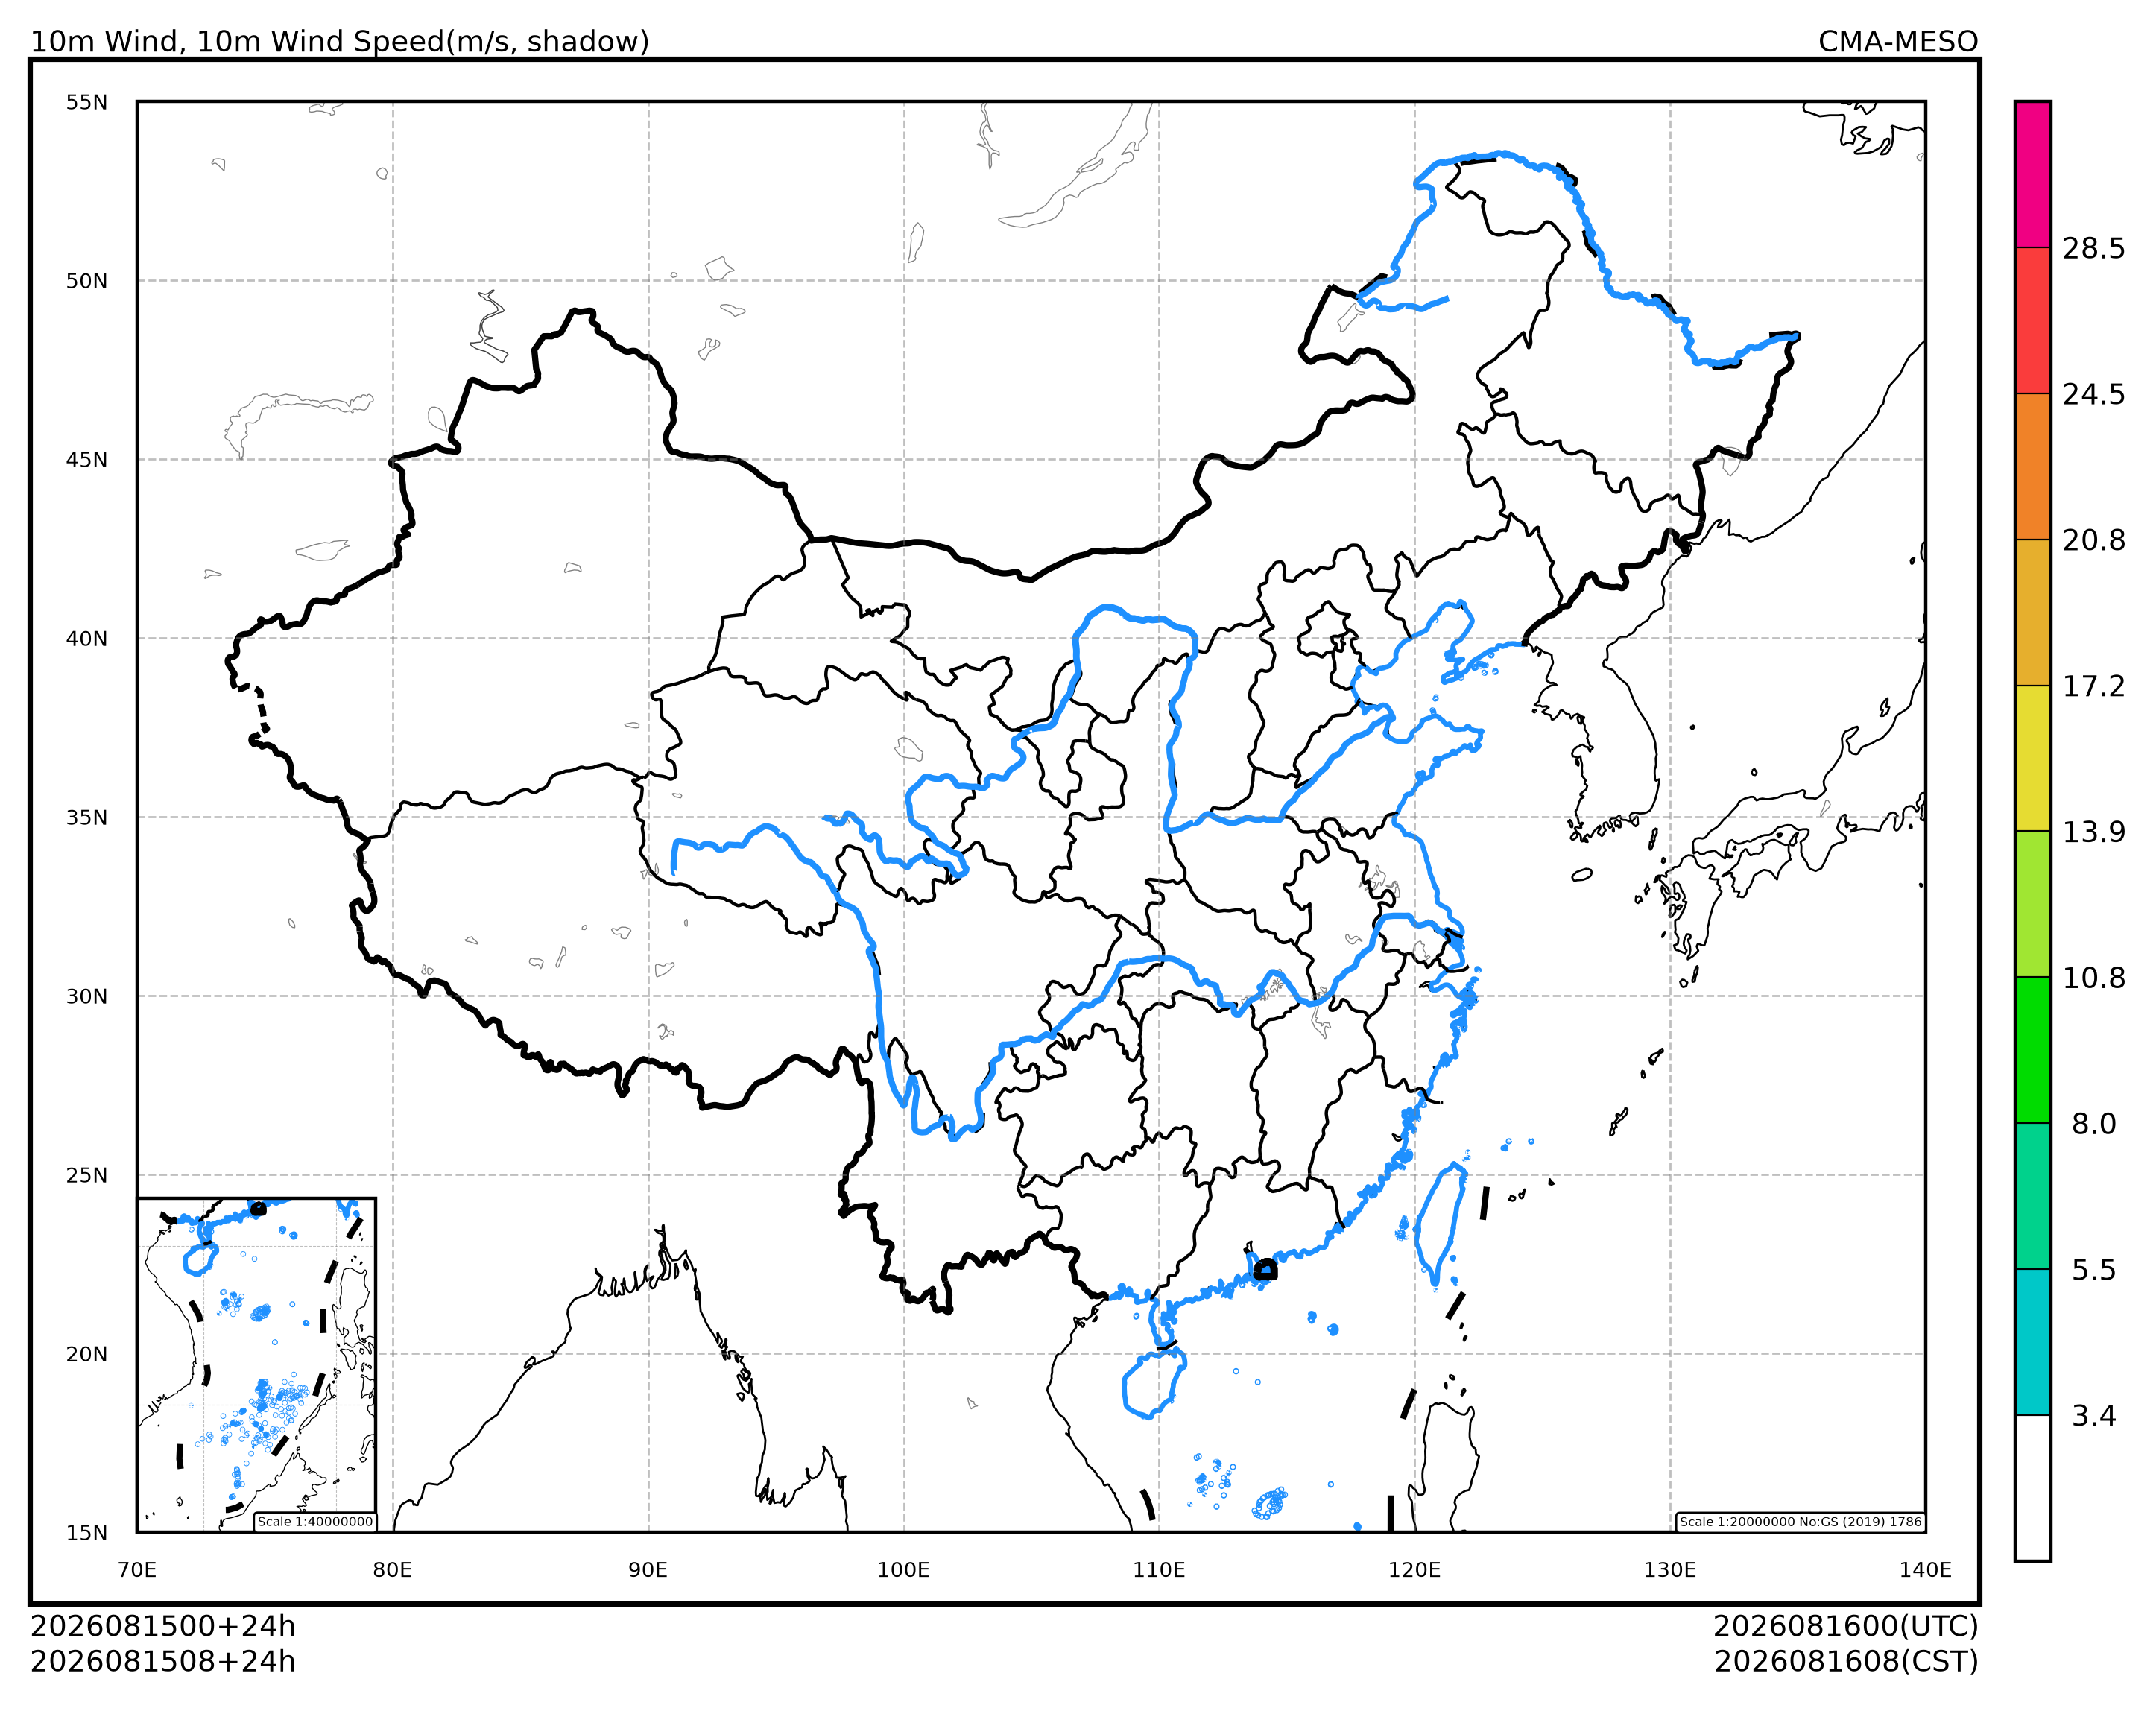
CEMC 地图 (cedarkit.plots.map.cemc.CemcMapLoader) 继承自默认底图,使用内部项目 cemc-meda-data 中的 CEMC 底图绘制中国海岸线、中国边界、中国省界、中国河流、南海九段线,并在 Global 模式中绘制全球国界。
准备
导入需要的包
import numpy as np
import pandas as pd
import matplotlib.colors as mcolors

from cedarkit.plots.chart import Panel
from cedarkit.plots.domains import EastAsiaMapTemplate
from cedarkit.plots.map import set_default_map_loader_package
from cedarkit.plots.style import ContourStyle
start_time = pd.Timestamp.now().normalize() - pd.Timedelta(days=2)
forecast_time = pd.to_timedelta("24h")
定义绘图样式
map_colors = np.array([
    (255, 255, 255),
    (0, 0, 0),
    (255, 255, 255),
    (0, 200, 200),
    (0, 210, 140),
    (0, 220, 0),
    (160, 230, 50),
    (230, 220, 50),
    (230, 175, 45),
    (240, 130, 40),
    (250, 60, 60),
    (240, 0, 130),
    (0, 0, 255),
    (255, 140, 0),
    (238, 18, 137)
], dtype=float) / 255
colormap = mcolors.ListedColormap(map_colors)

wind_speed_colormap = mcolors.ListedColormap(
    colormap(np.array([2, 3, 4, 5, 6, 7, 8, 9, 10, 11]))
)
wind_speed_contour_lev = np.array(
    [3.4, 5.5, 8, 10.8, 13.9, 17.2, 20.8, 24.5, 28.5]
)
wind_speed_style = ContourStyle(
    colors=wind_speed_colormap,
    levels=wind_speed_contour_lev,
    fill=True,
)绘制
设置使用 CEMC 地图包
set_default_map_loader_package("cedarkit.plots.map.cemc")'cedarkit.plots.map.cemc'绘制地图
domain = EastAsiaMapTemplate()
panel = Panel(domain=domain)

domain.set_title(
    panel=panel,
    graph_name="10m Wind, 10m Wind Speed(m/s, shadow)",
    system_name="CMA-MESO",
    start_time=start_time,
    forecast_time=pd.to_timedelta("24h"),
)
domain.add_colorbar(panel=panel, style=wind_speed_style)

panel.show()